QUESTION IMAGE
Question
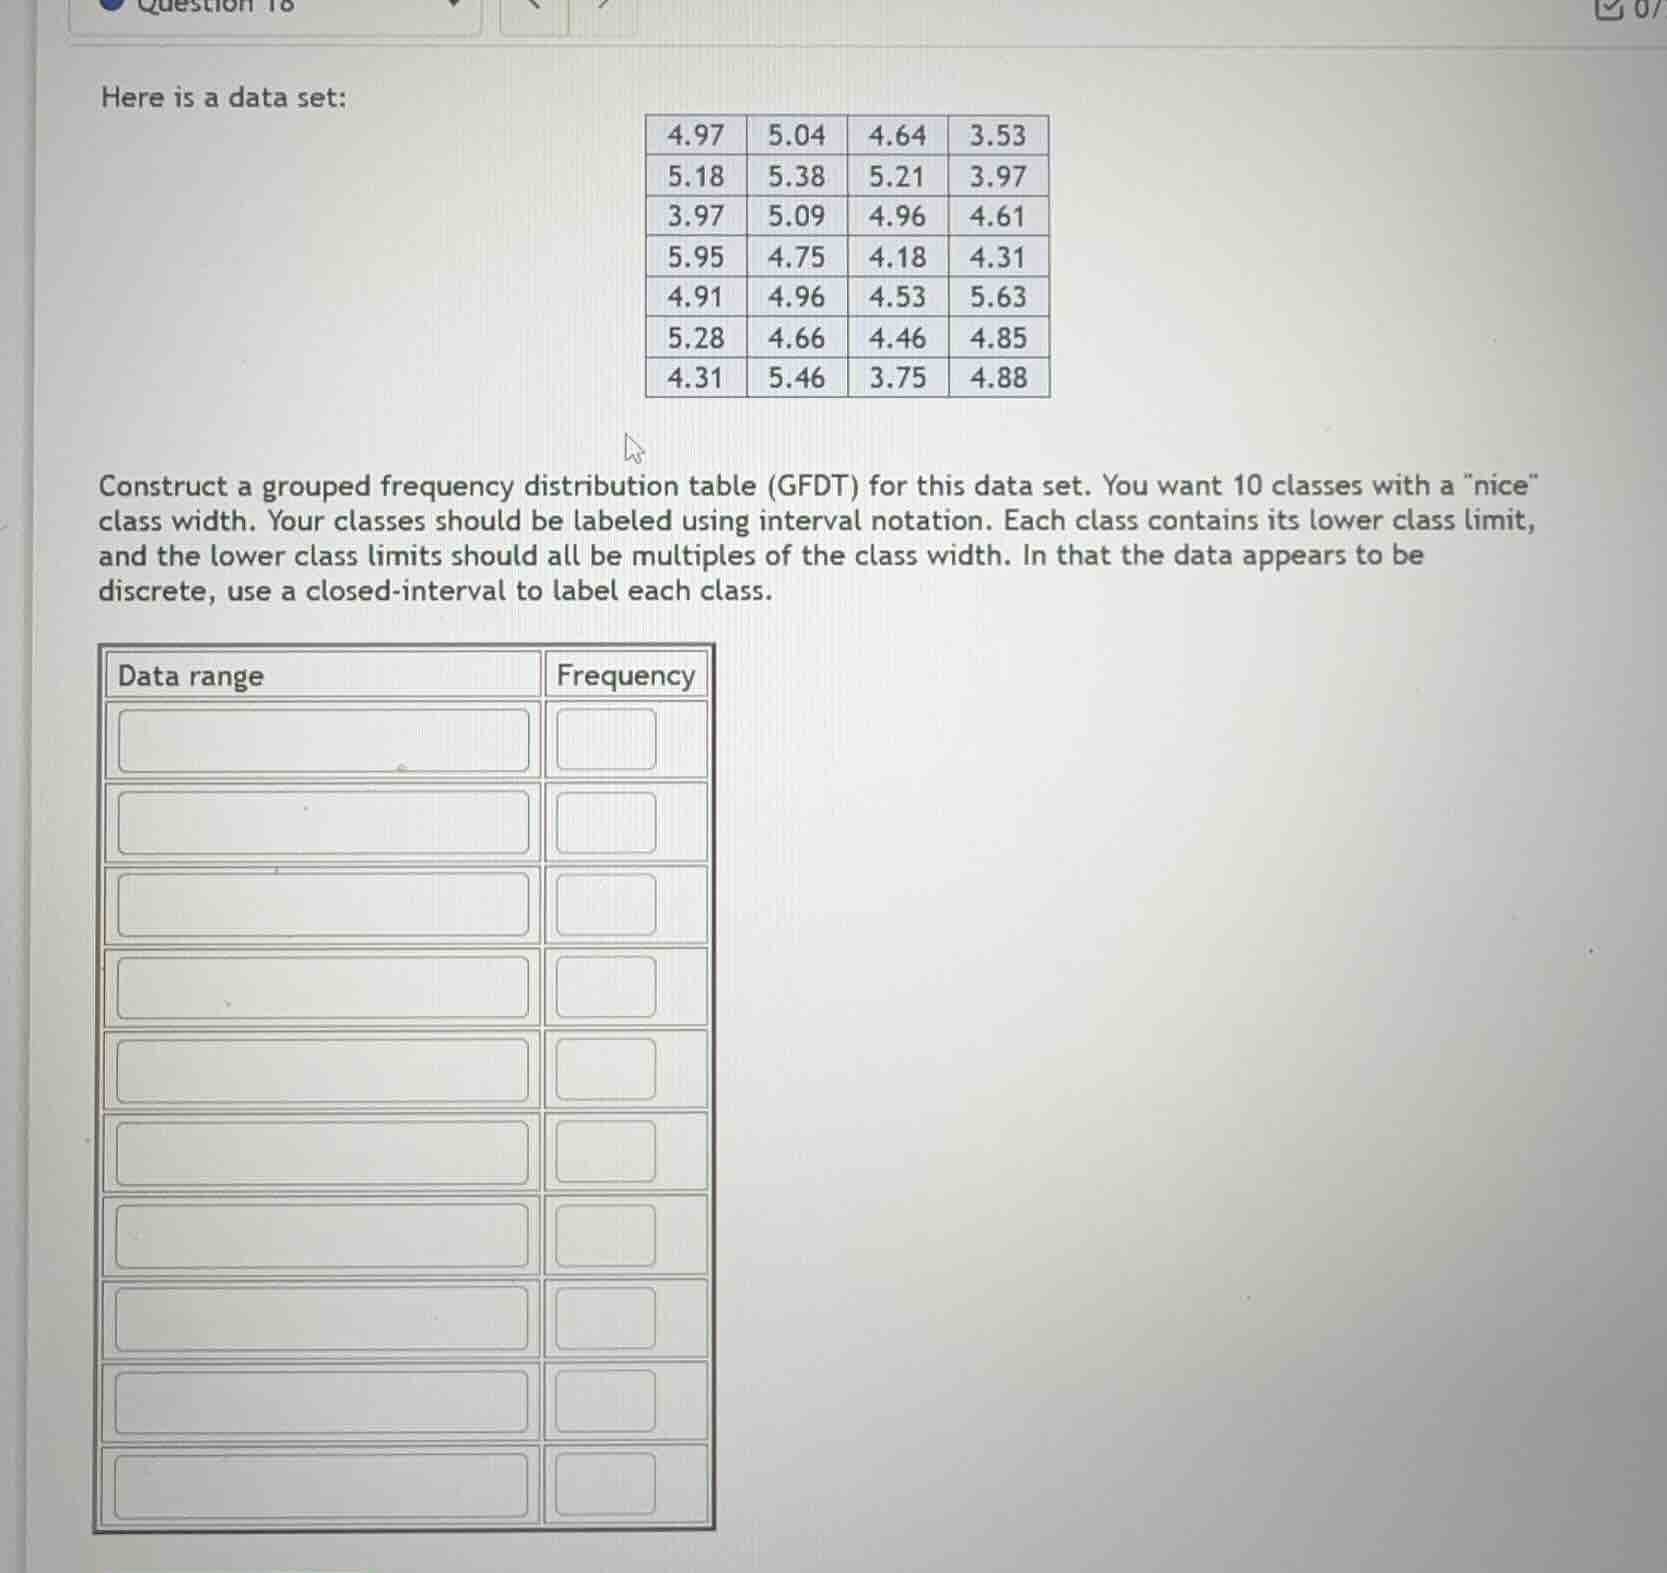
here is a data set:
4.97 5.04 4.64 3.53
5.18 5.38 5.21 3.97
3.97 5.09 4.96 4.61
5.95 4.75 4.18 4.31
4.91 4.96 4.53 5.63
5.28 4.66 4.46 4.85
4.31 5.46 3.75 4.88
construct a grouped frequency distribution table (gfdt) for this data set. you want 10 classes with a
ice\ class width. your classes should be labeled using interval notation. each class contains its lower class limit, and the lower class limits should all be multiples of the class width. in that the data appears to be discrete, use a closed-interval to label each class.
data range | frequency
--- | ---
Step1: Find min, max of data
Min = 3.53, Max = 5.95
Step2: Calculate class width
Range = $5.95 - 3.53 = 2.42$
Class width = $\frac{2.42}{10} \approx 0.25$ (nice width, multiple of 0.25)
Step3: Set lower class limits
Start at 3.50 (multiple of 0.25, ≤ min):
$3.50, 3.75, 4.00, 4.25, 4.50, 4.75, 5.00, 5.25, 5.50, 5.75$
Step4: Define closed intervals
Each interval: $[L, L+0.24]$ (since discrete, avoid overlap)
Step5: Count frequencies per interval
Tally data points in each class:
- $[3.50, 3.74]$: 3.53, 3.75? No, 3.75 is next lower limit. Correct: 3.53 → 1
- $[3.75, 3.99]$: 3.97, 3.97, 3.75 → 3
- $[4.00, 4.24]$: 4.18 → 1
- $[4.25, 4.49]$: 4.31, 4.31, 4.46 → 3
- $[4.50, 4.74]$: 4.64, 4.61, 4.53, 4.66 → 4
- $[4.75, 4.99]$: 4.97, 4.75, 4.91, 4.96, 4.96, 4.85, 4.88 → 7
- $[5.00, 5.24]$: 5.04, 5.18, 5.21, 5.09 → 4
- $[5.25, 5.49]$: 5.38, 5.28, 5.46 → 3
- $[5.50, 5.74]$: 5.63 → 1
- $[5.75, 5.99]$: 5.95 → 1

Snap & solve any problem in the app
Get step-by-step solutions on Sovi AI
Photo-based solutions with guided steps
Explore more problems and detailed explanations
| Data range | Frequency |
|---|---|
| $[3.75, 3.99]$ | 3 |
| $[4.00, 4.24]$ | 1 |
| $[4.25, 4.49]$ | 3 |
| $[4.50, 4.74]$ | 4 |
| $[4.75, 4.99]$ | 7 |
| $[5.00, 5.24]$ | 4 |
| $[5.25, 5.49]$ | 3 |
| $[5.50, 5.74]$ | 1 |
| $[5.75, 5.99]$ | 1 |