QUESTION IMAGE
Question
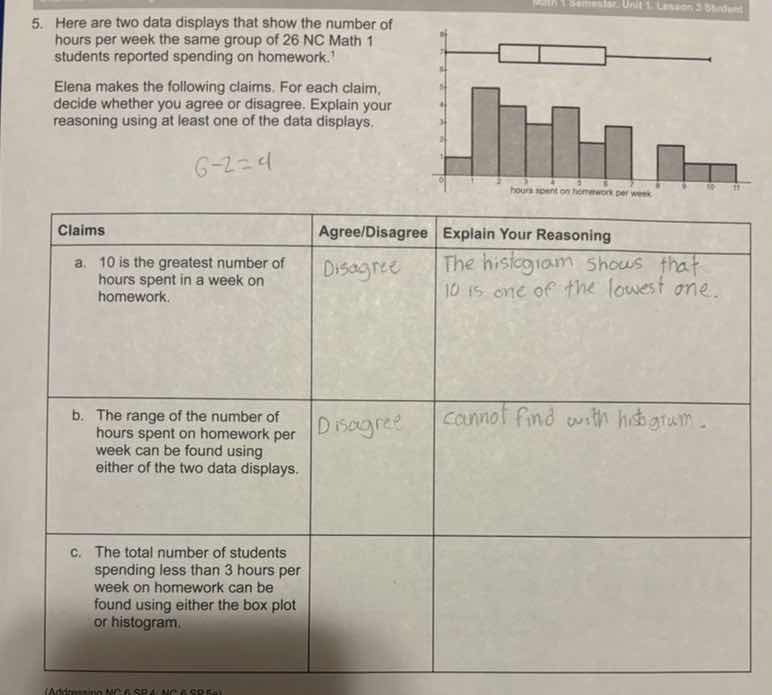
- here are two data displays that show the number of hours per week the same group of 26 nc math 1 students reported spending on homework. elena makes the following claims. for each claim, decide whether you agree or disagree. explain your reasoning using at least one of the data displays. (there is a box plot and a histogram shown, with the histogram labeled hours spent on homework per week on the x - axis from 0 to 11 and y - axis with some frequency values. then there is a table with three claims: a. 10 is the greatest number of hours spent in a week on homework. b. the range of the number of hours spent on homework per week can be found using either of the two data displays. c. the total number of students spending less than 3 hours per week on homework can be found using either the box plot or histogram. each claim has columns for agree/disagree and explain your reasoning, with some hand - written responses like disagree and explanations like the histogram shows that 10 is one of the lowest one. and cannot find with histogram already filled in.)
a. The box plot shows the maximum value extends beyond 10, so 10 is not the greatest number of hours. The histogram also has bars for 10-11 hours, confirming values above 10 exist.
b. The box plot clearly marks the minimum and maximum values, so we can calculate range (max - min) using it. The histogram's last bar shows the upper limit of the highest interval, and the first bar shows the lower limit of the lowest interval, so range can also be estimated from it.
c. A box plot only shows quartiles, median, min, and max; it does not provide the count of students in specific hour ranges. Only the histogram has bar heights that represent the number of students in each hour interval, so we can only find this total from the histogram.

Snap & solve any problem in the app
Get step-by-step solutions on Sovi AI
Photo-based solutions with guided steps
Explore more problems and detailed explanations
a. Disagree
Reasoning: The box plot shows the maximum hours are greater than 10, and the histogram has a bar for 10-11 hours, proving values above 10 exist.
b. Disagree
Reasoning: The box plot shows min/max to calculate range, and the histogram's interval limits allow range estimation.
c. Disagree
Reasoning: Box plots do not show counts of students in specific ranges; only the histogram can provide this total.