QUESTION IMAGE
Question
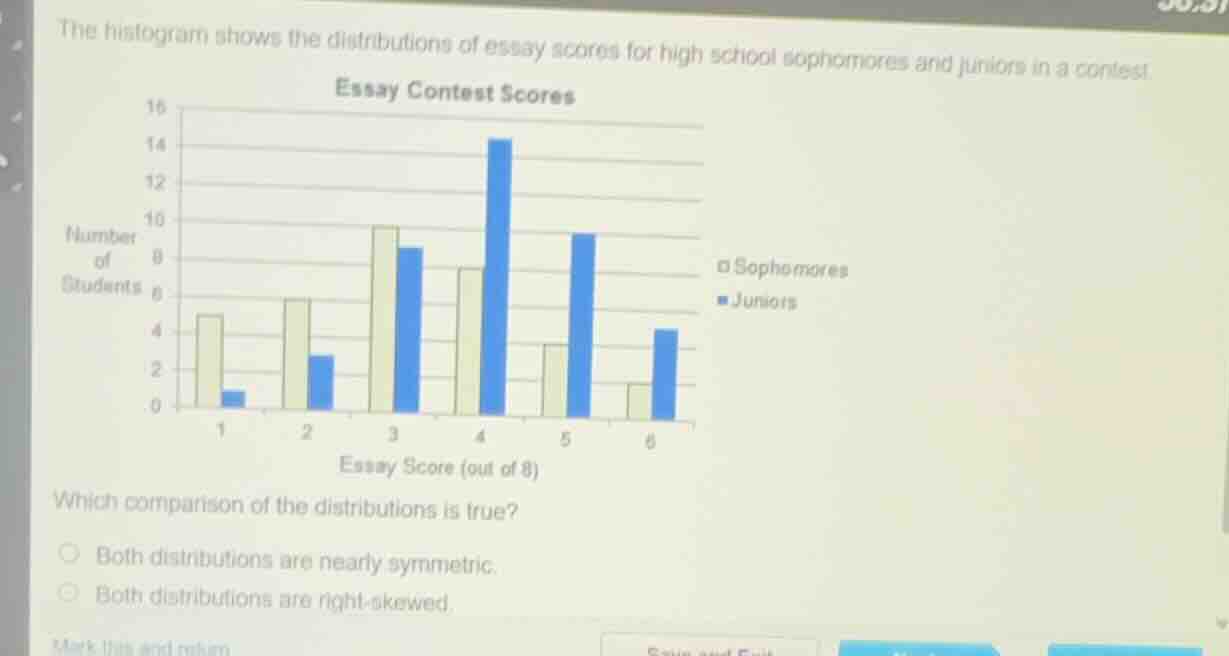
the histogram shows the distributions of essay scores for high school sophomores and juniors in a contest.
essay contest scores
which comparison of the distributions is true?
both distributions are nearly symmetric.
both distributions are right - skewed.
To determine the skewness of the distributions, we analyze the histograms for sophomores (light - colored bars) and juniors (dark - colored bars). For a right - skewed distribution, the tail of the distribution is on the right side (higher values). For a symmetric distribution, the data is evenly distributed around the center.
Looking at the sophomore distribution: The number of students is higher for lower scores (1, 2, 3, 4) and then decreases for higher scores (5, 6). The tail is on the right (towards higher scores like 5 and 6).
Looking at the junior distribution: Similarly, the number of students is higher for lower - middle scores (3, 4) and then the number of students for higher scores (5, 6) is less compared to the middle scores. The tail is also on the right (towards higher scores like 5 and 6).
A symmetric distribution would have a more balanced number of data points on both sides of the center. Since both distributions have their tails on the right, both distributions are right - skewed. The option "Both distributions are nearly symmetric" is incorrect because the data is not balanced around the center for either group.

Snap & solve any problem in the app
Get step-by-step solutions on Sovi AI
Photo-based solutions with guided steps
Explore more problems and detailed explanations
Both distributions are right - skewed.