QUESTION IMAGE
Question
homework #1
ec-101 hw1 pdf.pdf
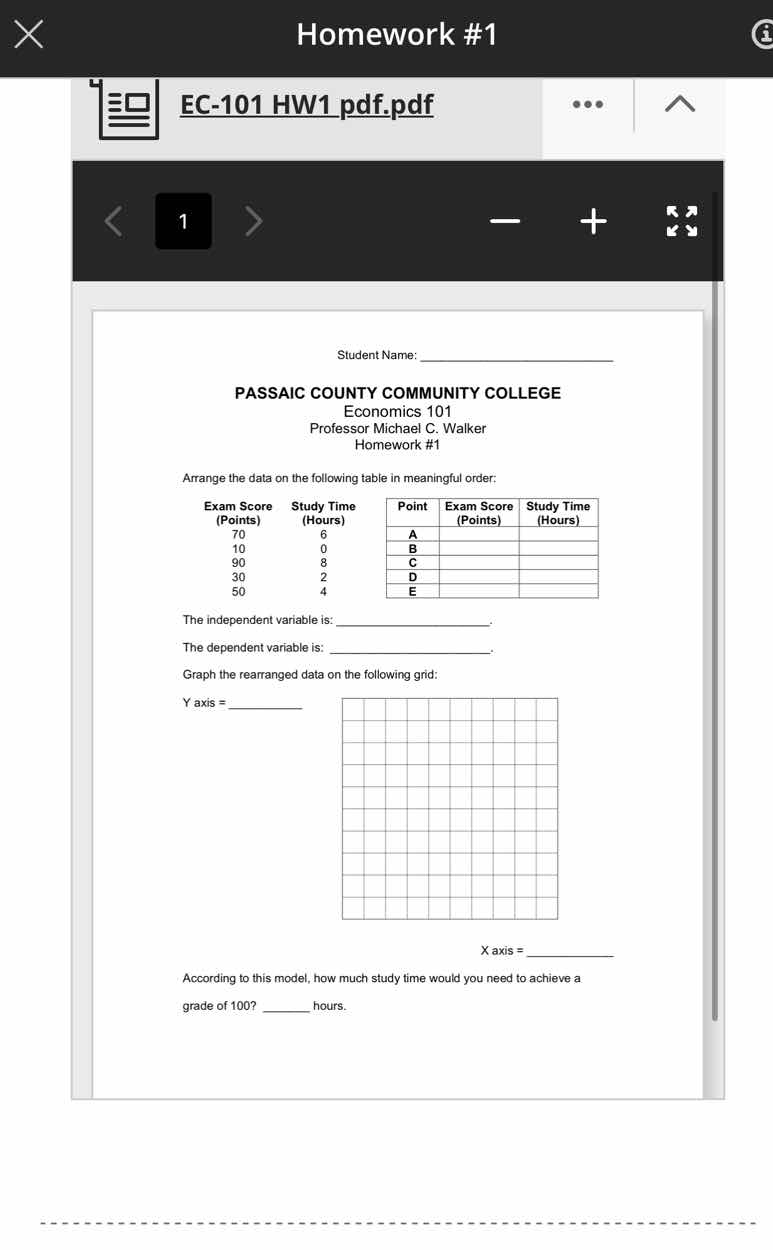
student name: _________________________
passaic county community college
economics 101
professor michael c. walker
homework #1
arrange the data on the following table in meaningful order:
exam score (points) study time (hours)
70 6
10 0
90 8
30 2
50 4
point exam score (points) study time (hours)
a
b
c
d
e
the independent variable is: _________________________.
the dependent variable is: _________________________.
graph the rearranged data on the following grid:
y axis = _________
x axis = _________
according to this model, how much study time would you need to achieve a grade of 100? ______ hours.
Step1: Sort by Study Time
Order rows from lowest to highest study time:
| Point | Exam Score (Points) | Study Time (Hours) |
|---|---|---|
| B | 30 | 2 |
| C | 50 | 4 |
| D | 70 | 6 |
| E | 90 | 8 |
Step2: Identify variables
Independent variable: affects the dependent variable; here, study time controls exam score.
Dependent variable: depends on the independent variable; exam score changes with study time.
Step3: Assign graph axes
X-axis: independent variable (Study Time)
Y-axis: dependent variable (Exam Score)
Step4: Find slope of the model
Calculate rate of score change per hour:
$\text{Slope} = \frac{\Delta \text{Exam Score}}{\Delta \text{Study Time}} = \frac{90-10}{8-0} = \frac{80}{8} = 10$ points/hour
Linear model: $y = 10x + 10$ (where $y$=exam score, $x$=study time; y-intercept=10, score at 0 hours)
Step5: Solve for x when y=100
Substitute $y=100$ into the model:
$100 = 10x + 10$
$10x = 100 - 10 = 90$
$x = \frac{90}{10} = 9$

Snap & solve any problem in the app
Get step-by-step solutions on Sovi AI
Photo-based solutions with guided steps
Explore more problems and detailed explanations
- Sorted Table:
| Point | Exam Score (Points) | Study Time (Hours) |
|---|---|---|
| B | 30 | 2 |
| C | 50 | 4 |
| D | 70 | 6 |
| E | 90 | 8 |
- Independent variable: Study Time (Hours)
- Dependent variable: Exam Score (Points)
- Graph Axes:
Y axis = Exam Score (Points)
X axis = Study Time (Hours)
- Study time for grade 100: 9 hours