QUESTION IMAGE
Question
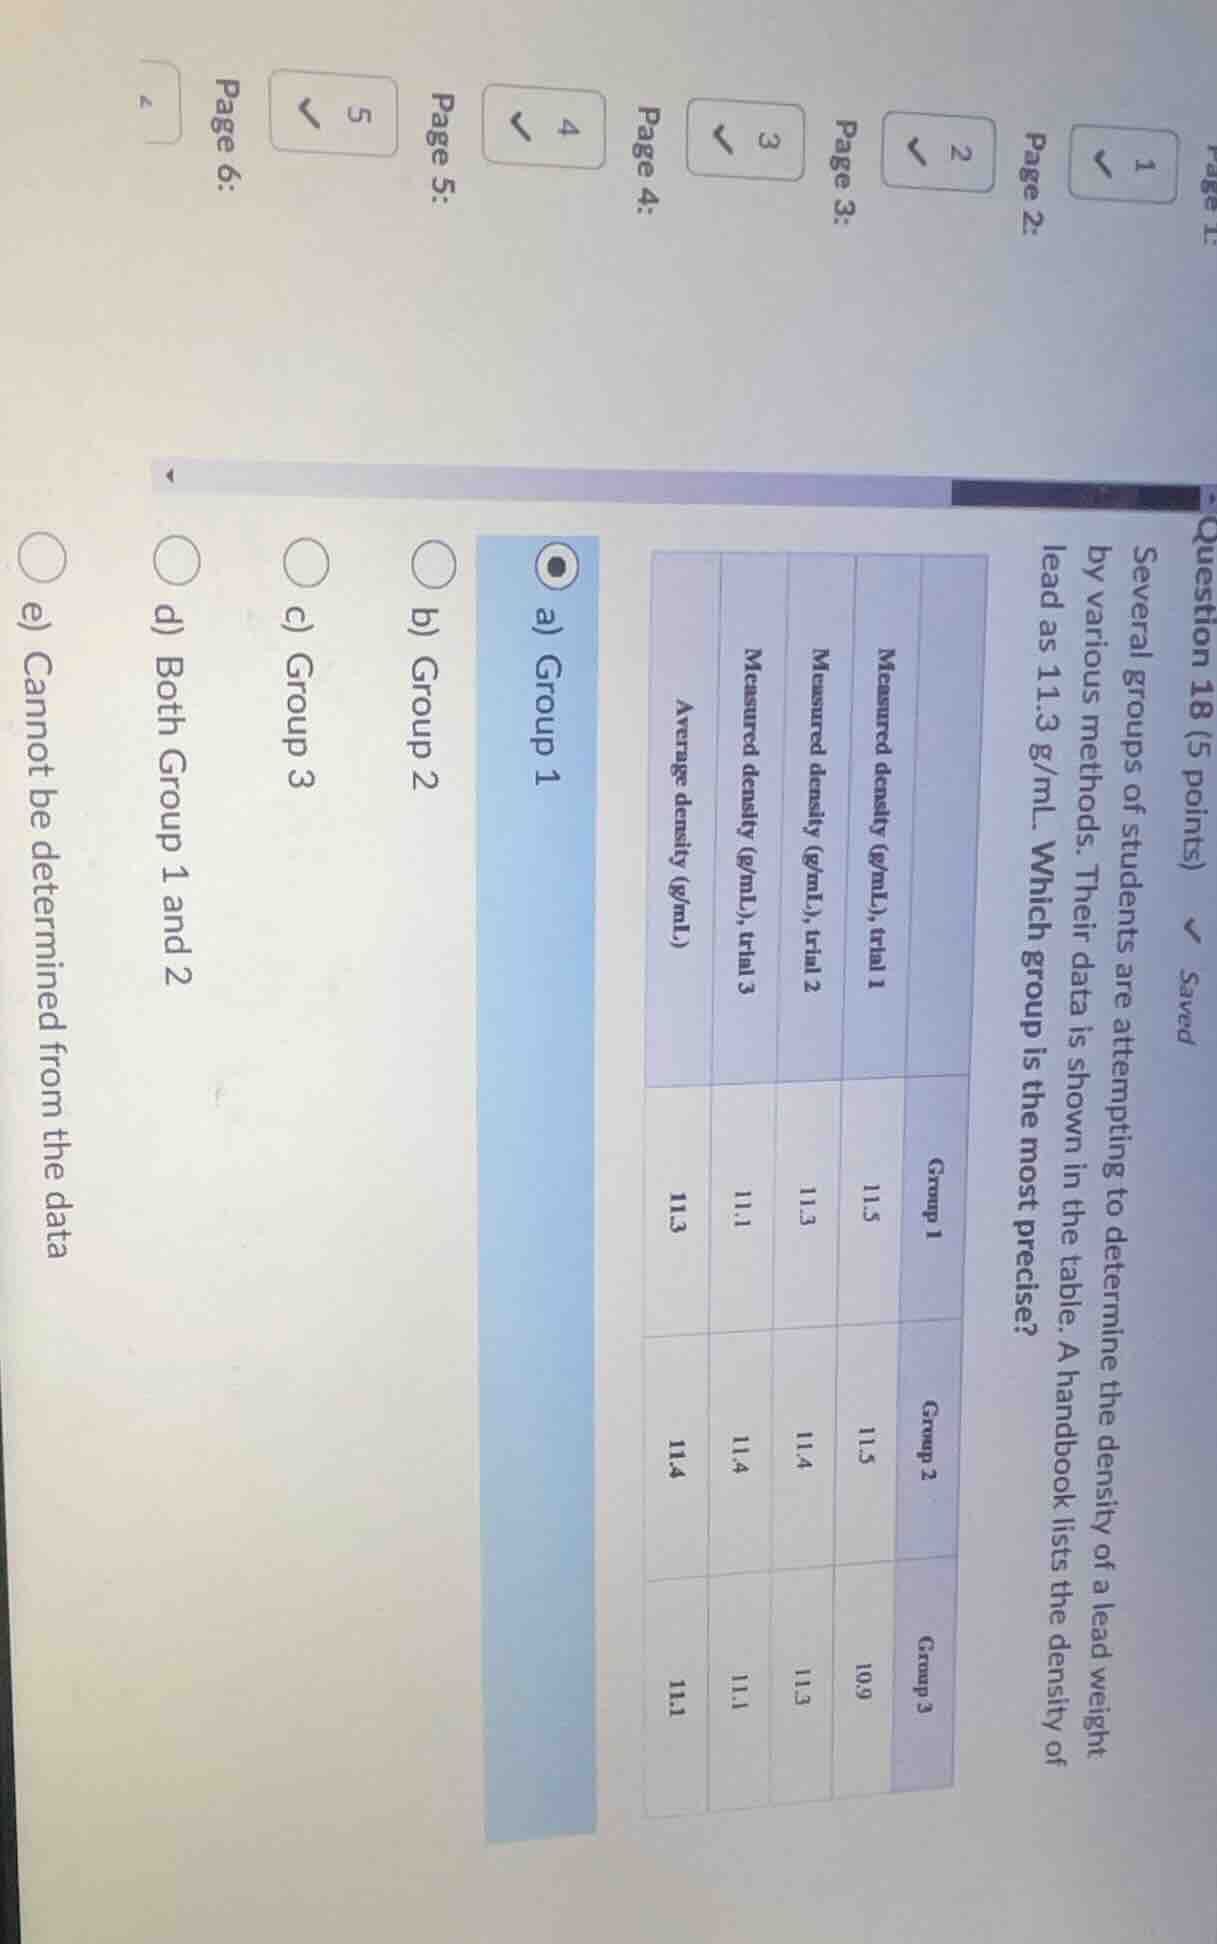
Question was provided via image upload.
To determine precision, we look at the consistency of measurements (how close the values are to each other).
Step 1: Analyze Group 1's data
Group 1 measurements: \( 11.5, 11.3, 11.1, 11.3 \)
Range: \( 11.5 - 11.1 = 0.4 \)
Deviations from average (\( 11.3 \)): \( 0.2, 0, -0.2, 0 \) (variation around average)
Step 2: Analyze Group 2's data
Group 2 measurements: \( 11.5, 11.4, 11.4, 11.4 \)
Range: \( 11.5 - 11.4 = 0.1 \)
Deviations from average (\( 11.4 \)): \( 0.1, 0, 0, 0 \) (very small variation)
Step 3: Analyze Group 3's data
Group 3 measurements: \( 10.9, 11.3, 11.1, 11.1 \)
Range: \( 11.3 - 10.9 = 0.4 \)
Deviations from average (\( 11.1 \)): \( -0.2, 0.2, 0, 0 \) (larger variation than Group 2)
Group 2’s measurements are the most consistent (smallest range, deviations close to zero), so they are the most precise.

Snap & solve any problem in the app
Get step-by-step solutions on Sovi AI
Photo-based solutions with guided steps
Explore more problems and detailed explanations
b) Group 2