QUESTION IMAGE
Question
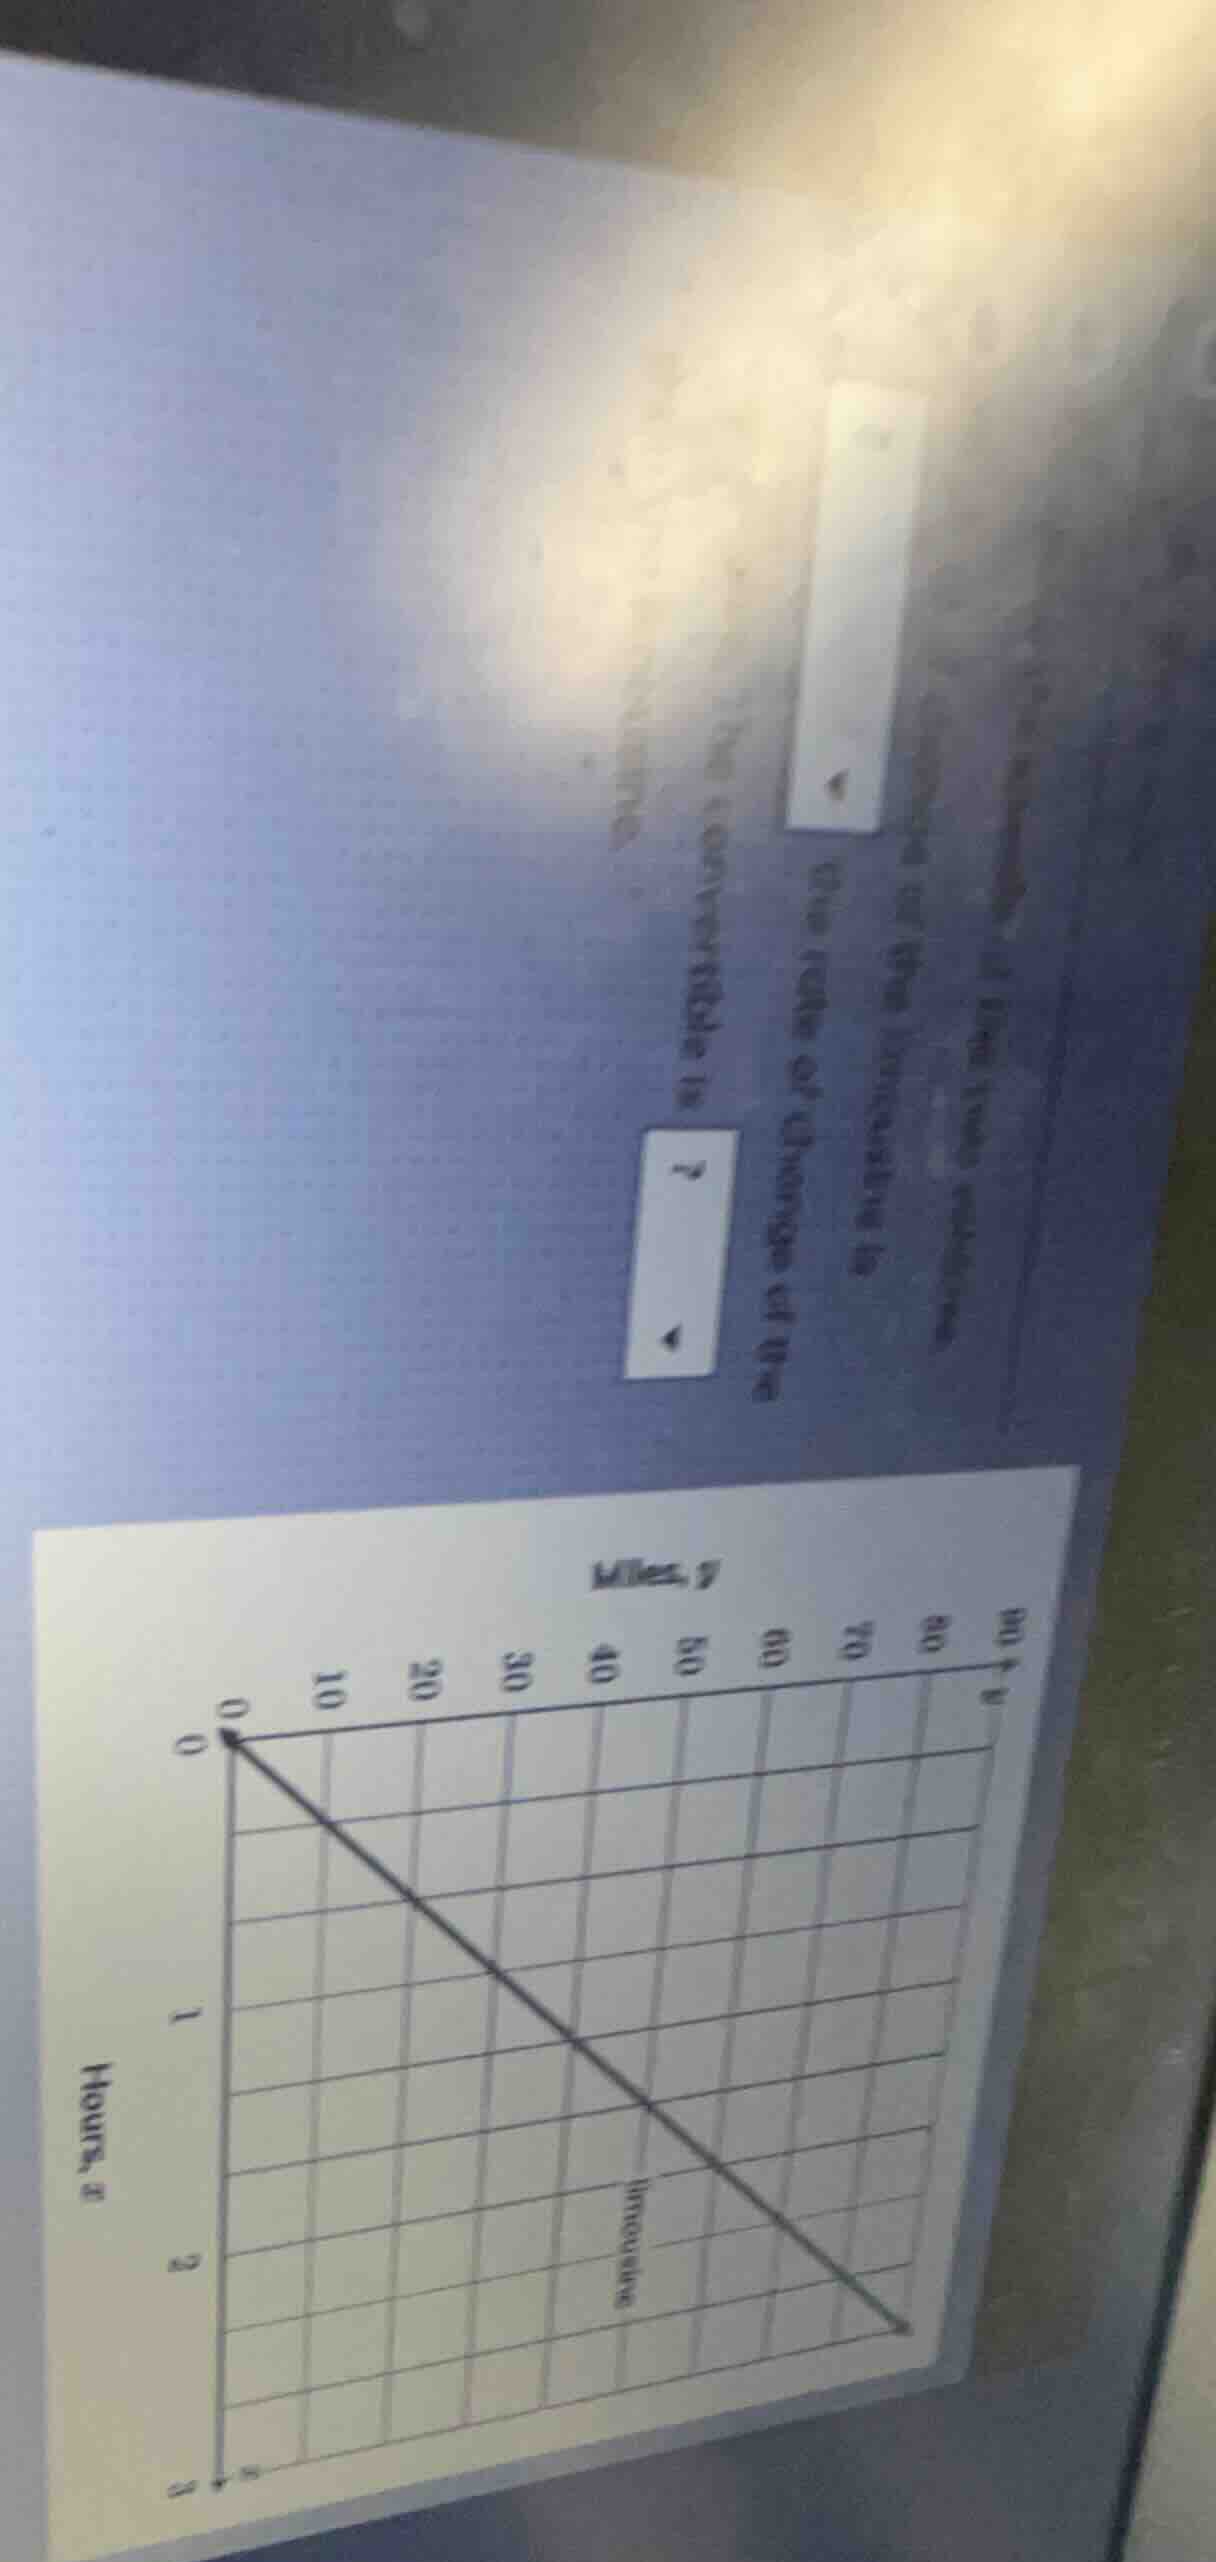
the image shows a graph with x - axis labeled hours, x and y - axis labeled y. the line passes through the origin (0,0) and another point. there are some text boxes with ? indicating missing information related to the line, such as the line is..., rate of change of the..., variable is....
Step1: Identify two points on the line
From the graph, when \( x = 0 \) (hours), \( y = 0 \) (miles). When \( x = 2 \) (hours), \( y = 80 \) (miles).
Step2: Calculate the rate of change (slope)
The formula for the rate of change (slope) \( m \) is \( m=\frac{y_2 - y_1}{x_2 - x_1} \). Substituting the points \((0,0)\) and \((2,80)\), we get \( m=\frac{80 - 0}{2 - 0}=\frac{80}{2}=40 \).

Snap & solve any problem in the app
Get step-by-step solutions on Sovi AI
Photo-based solutions with guided steps
Explore more problems and detailed explanations
The rate of change of the line (miles per hour) is 40.