QUESTION IMAGE
Question
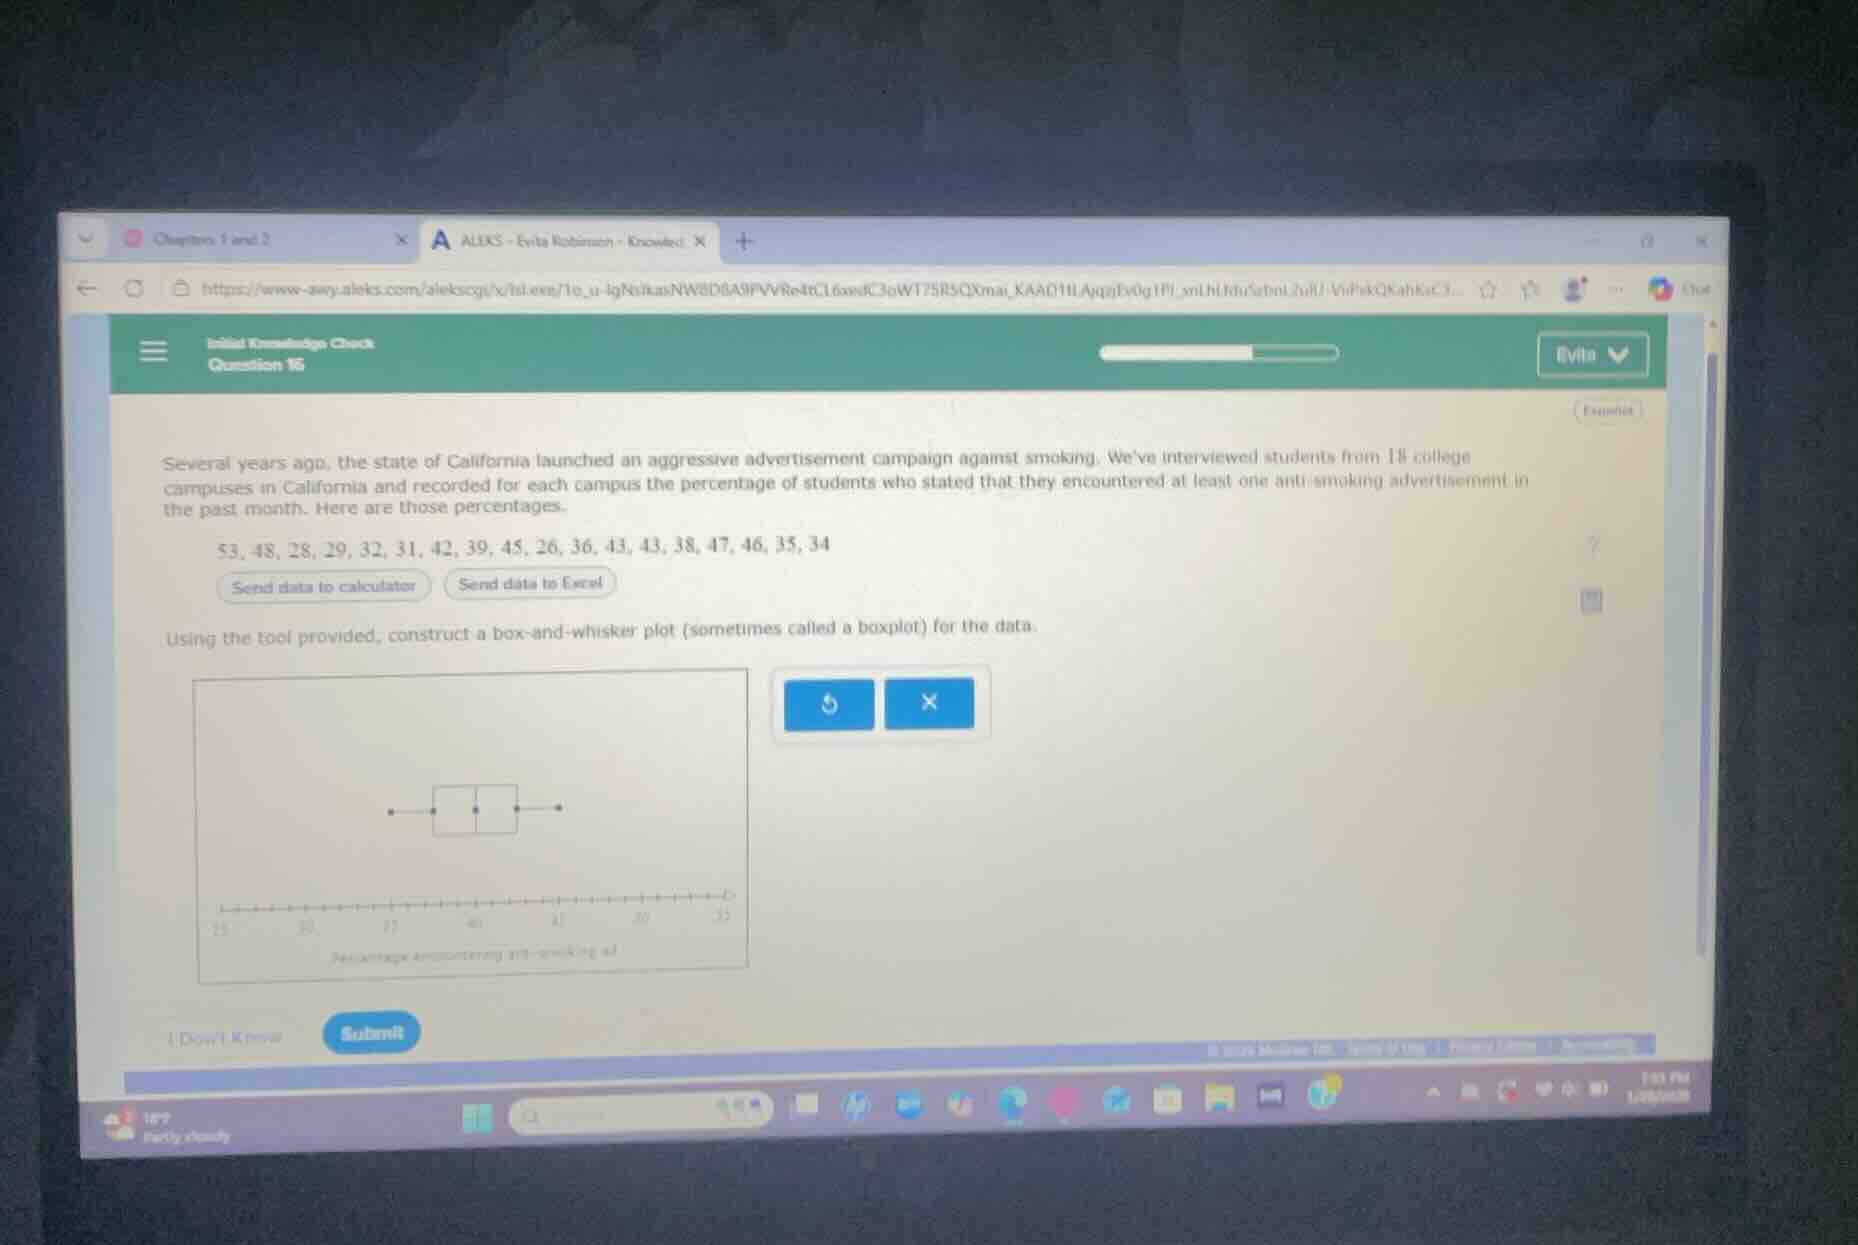
initial knowledge check question 16 several years ago, the state of california launched an aggressive advertisement campaign against smoking. weve interviewed students from 18 college campuses in california and recorded for each campus the percentage of students who stated that they encountered at least one anti - smoking advertisement in the past month. here are those percentages. 53, 48, 28, 29, 32, 31, 42, 39, 45, 26, 36, 43, 43, 38, 47, 46, 35, 34 send data to calculator send data to excel using the tool provided, construct a box - and - whisker plot (sometimes called a boxplot) for the data.
Step1: Sort the data set
Sorted data: $26, 28, 29, 31, 32, 34, 35, 36, 38, 39, 42, 43, 43, 45, 45, 46, 47, 53$
Step2: Find minimum value
Minimum = smallest value in sorted data
$\text{Min} = 26$
Step3: Calculate Q1 (25th percentile)
Q1 = median of first half of data: $26, 28, 29, 31, 32, 34, 35, 36, 38$
$\text{Q1} = 32$
Step4: Calculate median (Q2, 50th percentile)
Median = average of 9th and 10th values
$\text{Median} = \frac{38 + 39}{2} = 38.5$
Step5: Calculate Q3 (75th percentile)
Q3 = median of second half of data: $39, 42, 43, 43, 45, 45, 46, 47, 53$
$\text{Q3} = 45$
Step6: Find maximum value
Maximum = largest value in sorted data
$\text{Max} = 53$
Step7: Define boxplot bounds
Whiskers: from $\text{Min}=26$ to $\text{Max}=53$. Box: from $\text{Q1}=32$ to $\text{Q3}=45$, with median line at $38.5$.

Snap & solve any problem in the app
Get step-by-step solutions on Sovi AI
Photo-based solutions with guided steps
Explore more problems and detailed explanations
To construct the box-and-whisker plot:
- Draw whiskers from the minimum value 26 to the maximum value 53
- Draw a box from the first quartile 32 to the third quartile 45
- Draw a vertical line inside the box at the median value 38.5