QUESTION IMAGE
Question
instructions
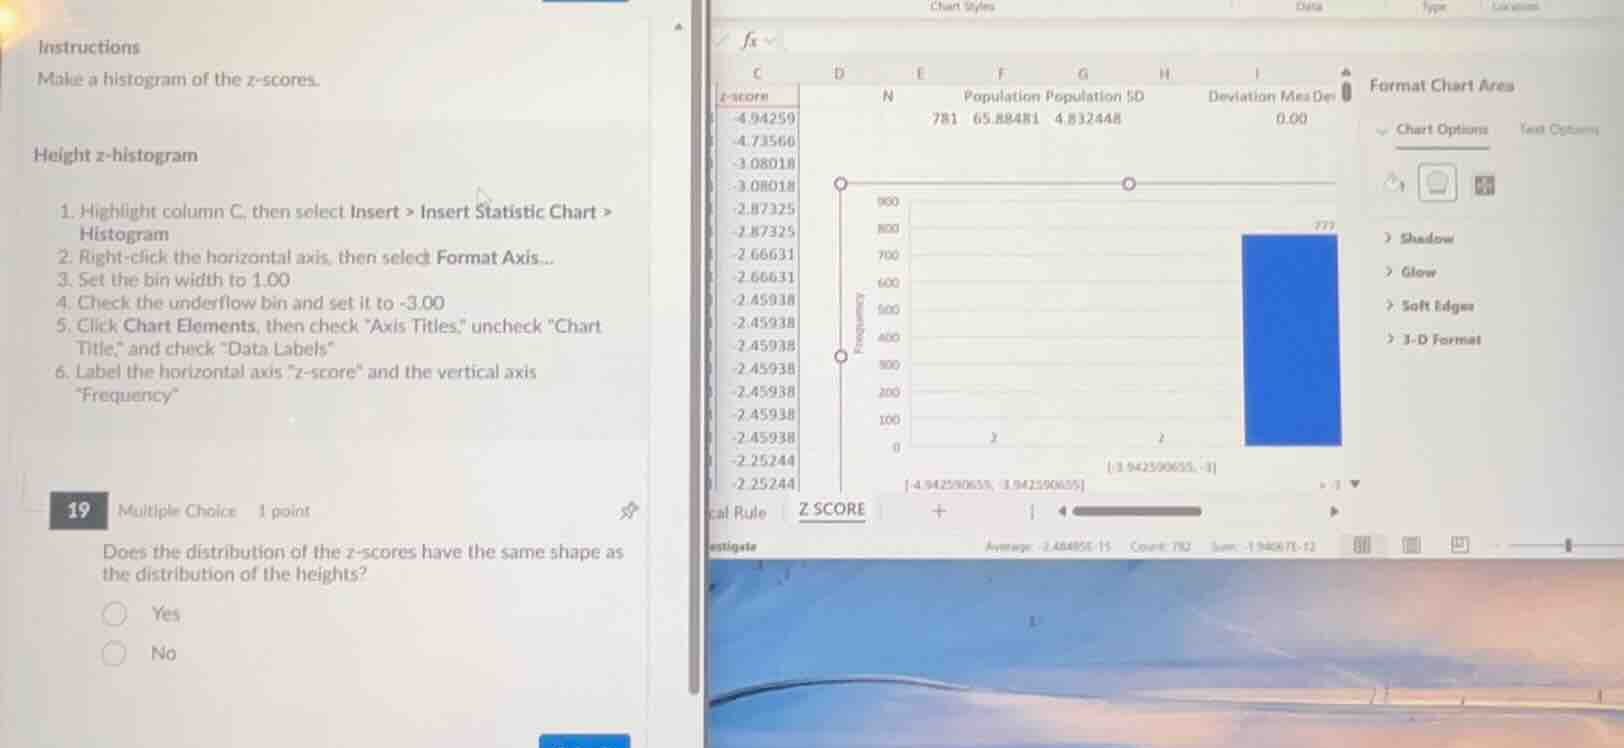
make a histogram of the z - scores.
height z - histogram
- highlight column c, then select insert > insert statistic chart > histogram
- right - click the horizontal axis, then select format axis...
- set the bin width to 1.00
- check the underflow bin and set it to - 3.00
- click chart elements, then check \axis titles,\ uncheck \chart title,\ and check \data labels\
- label the horizontal axis \z - score\ and the vertical axis \frequency\
19 multiple choice 1 point
does the distribution of the z - scores have the same shape as the distribution of the heights?
yes
no
Brief Explanations
Converting data to z-scores is a linear transformation ($z = \frac{x-\mu}{\sigma}$) that only rescales and shifts the data, not altering the overall shape of the distribution.

Snap & solve any problem in the app
Get step-by-step solutions on Sovi AI
Photo-based solutions with guided steps
Explore more problems and detailed explanations
Yes