QUESTION IMAGE
Question
investigation
plot it
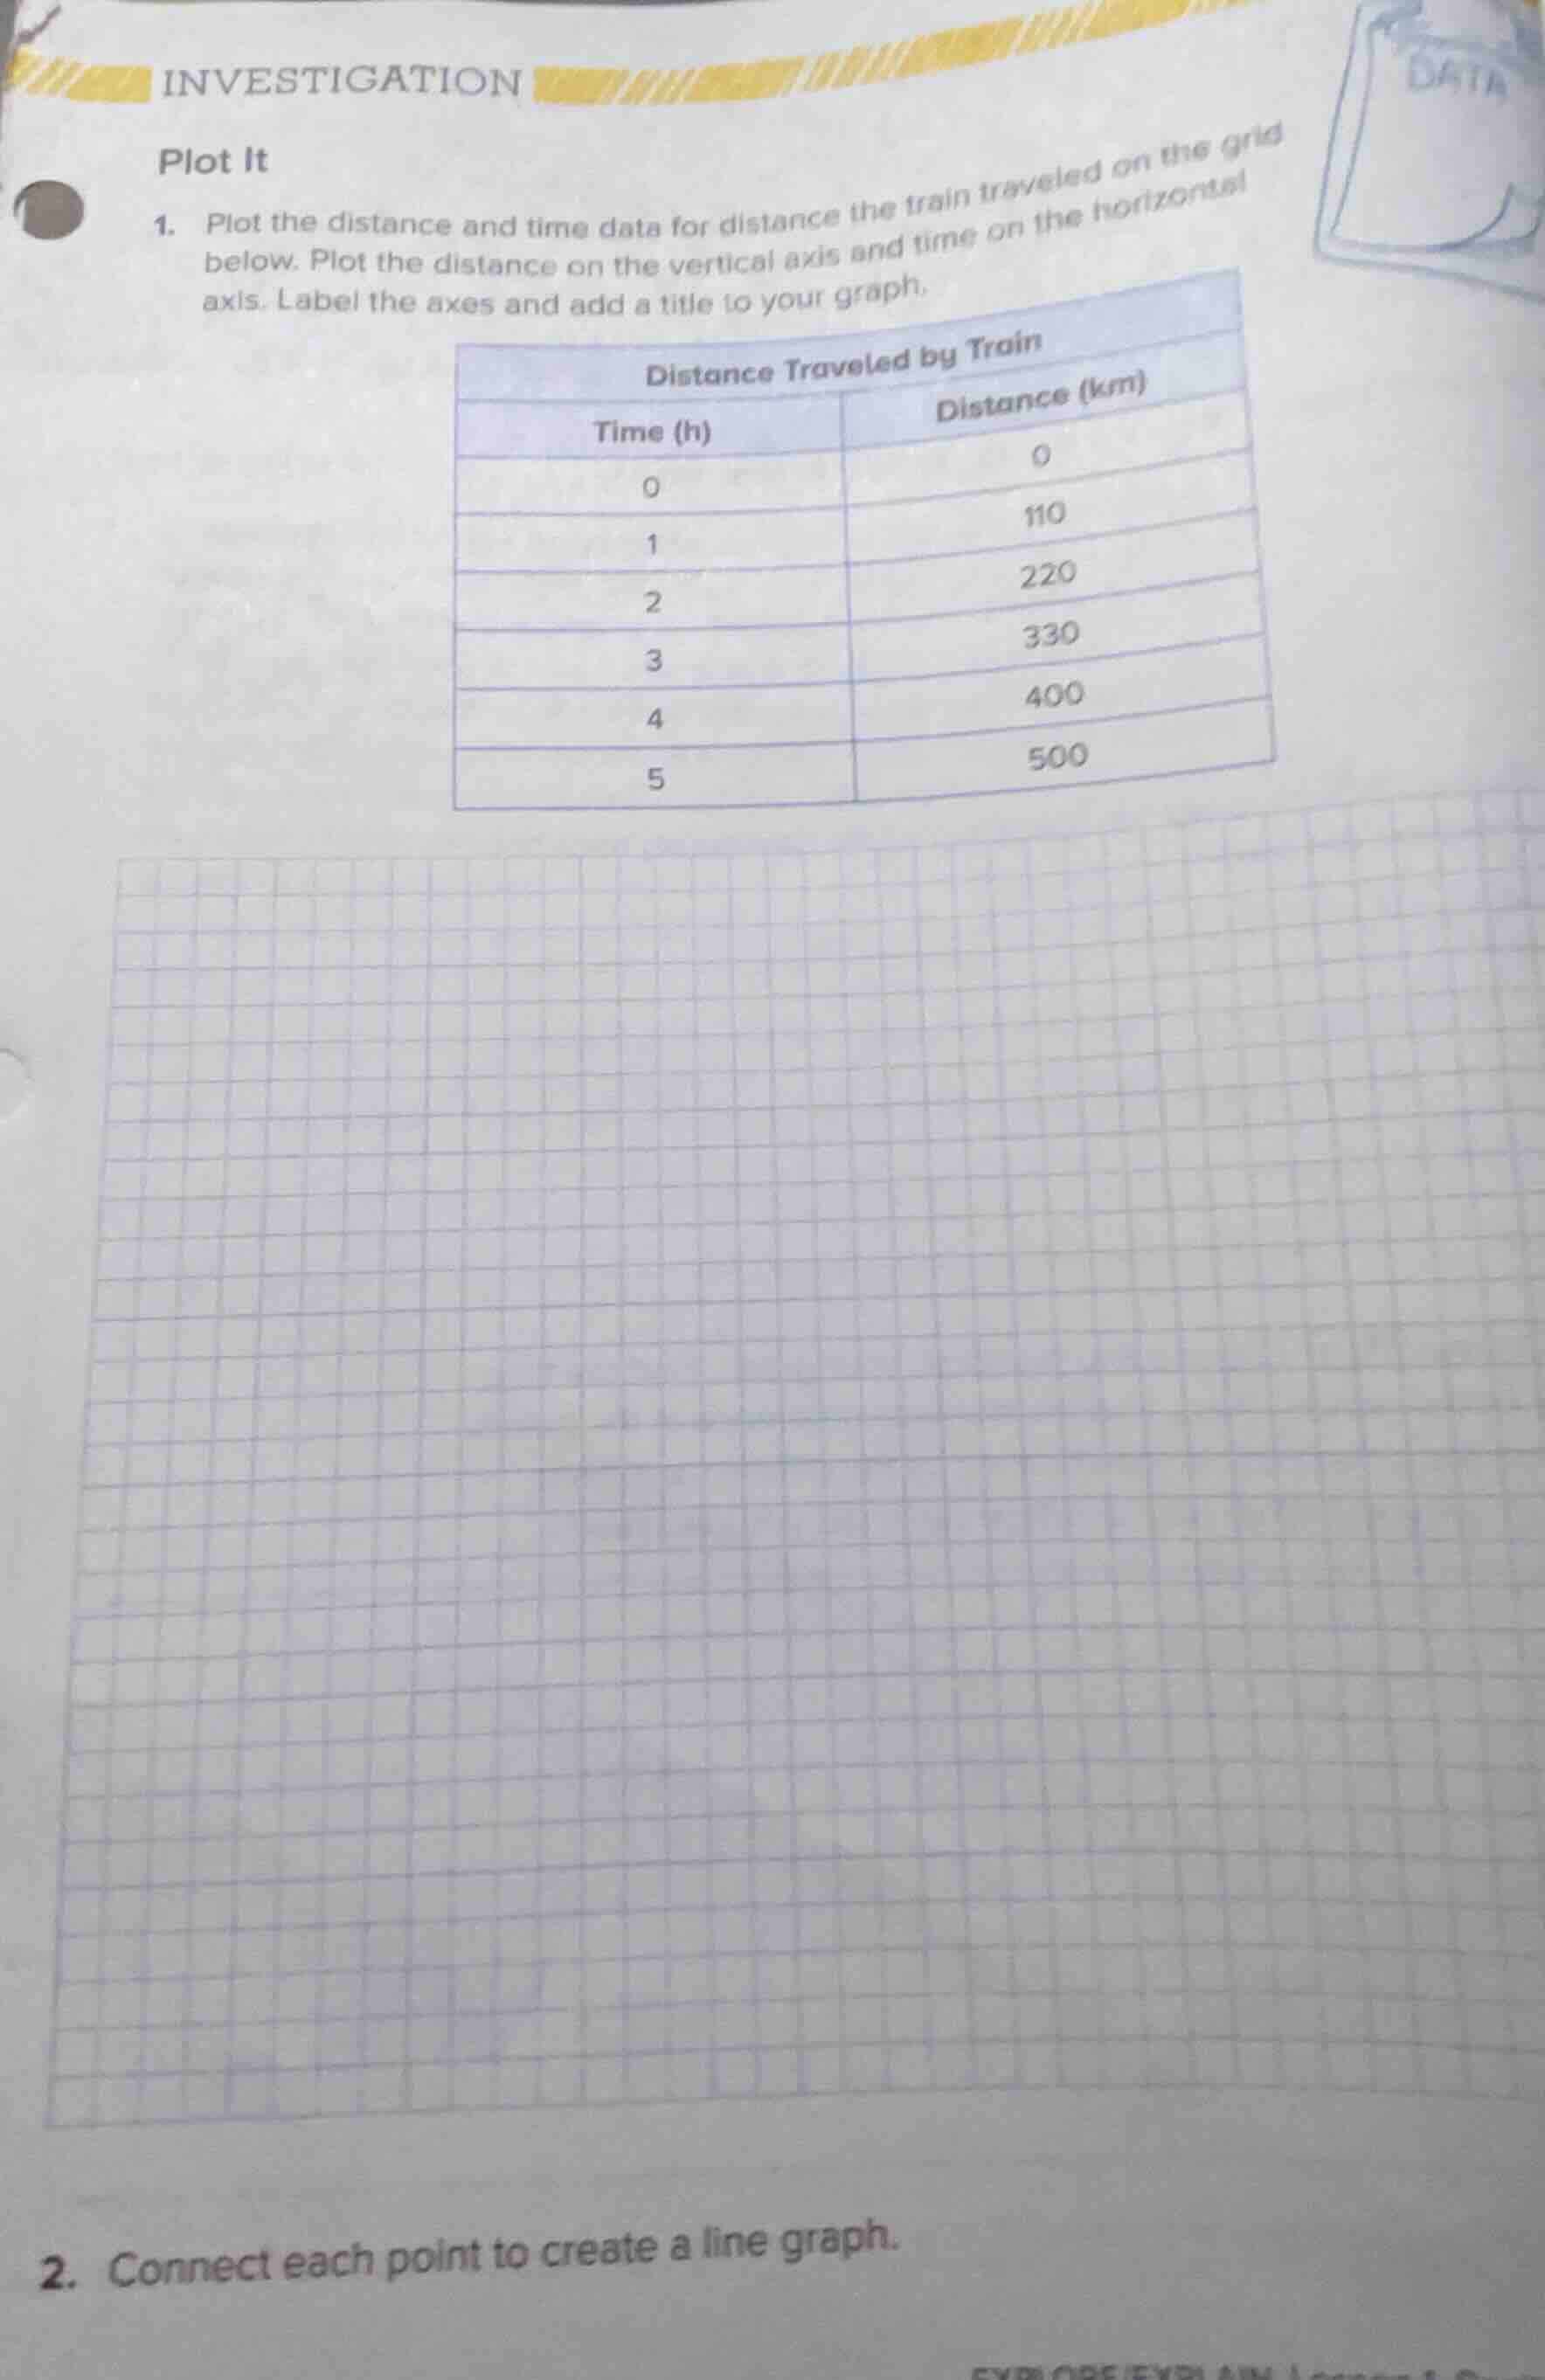
- plot the distance and time data for distance the train traveled on the grid below. plot the distance on the vertical axis and time on the horizontal axis. label the axes and add a title to your graph.
distance traveled by train
| time (h) | distance (km) |
|---|---|
| 1 | 110 |
| 2 | 220 |
| 3 | 330 |
| 4 | 400 |
| 5 | 500 |
- connect each point to create a line graph.
Step1: Set up graph axes
- Label horizontal axis: Time (h), mark ticks 0,1,2,3,4,5
- Label vertical axis: Distance (km), set scale (e.g., each grid = 20 km, mark ticks 0,100,200,300,400,500)
- Add title: Distance Traveled by Train Over Time
Step2: Plot data points
Plot coordinates:
$(0,0)$, $(1,110)$, $(2,220)$, $(3,330)$, $(4,400)$, $(5,500)$
Step3: Connect plotted points
Draw straight lines between consecutive plotted points to form a line graph.

Snap & solve any problem in the app
Get step-by-step solutions on Sovi AI
Photo-based solutions with guided steps
Explore more problems and detailed explanations
A line graph with:
- Horizontal axis labeled Time (h) (0 to 5)
- Vertical axis labeled Distance (km) (0 to 500)
- Title: Distance Traveled by Train Over Time
- Plotted and connected points: (0,0), (1,110), (2,220), (3,330), (4,400), (5,500)