QUESTION IMAGE
Question
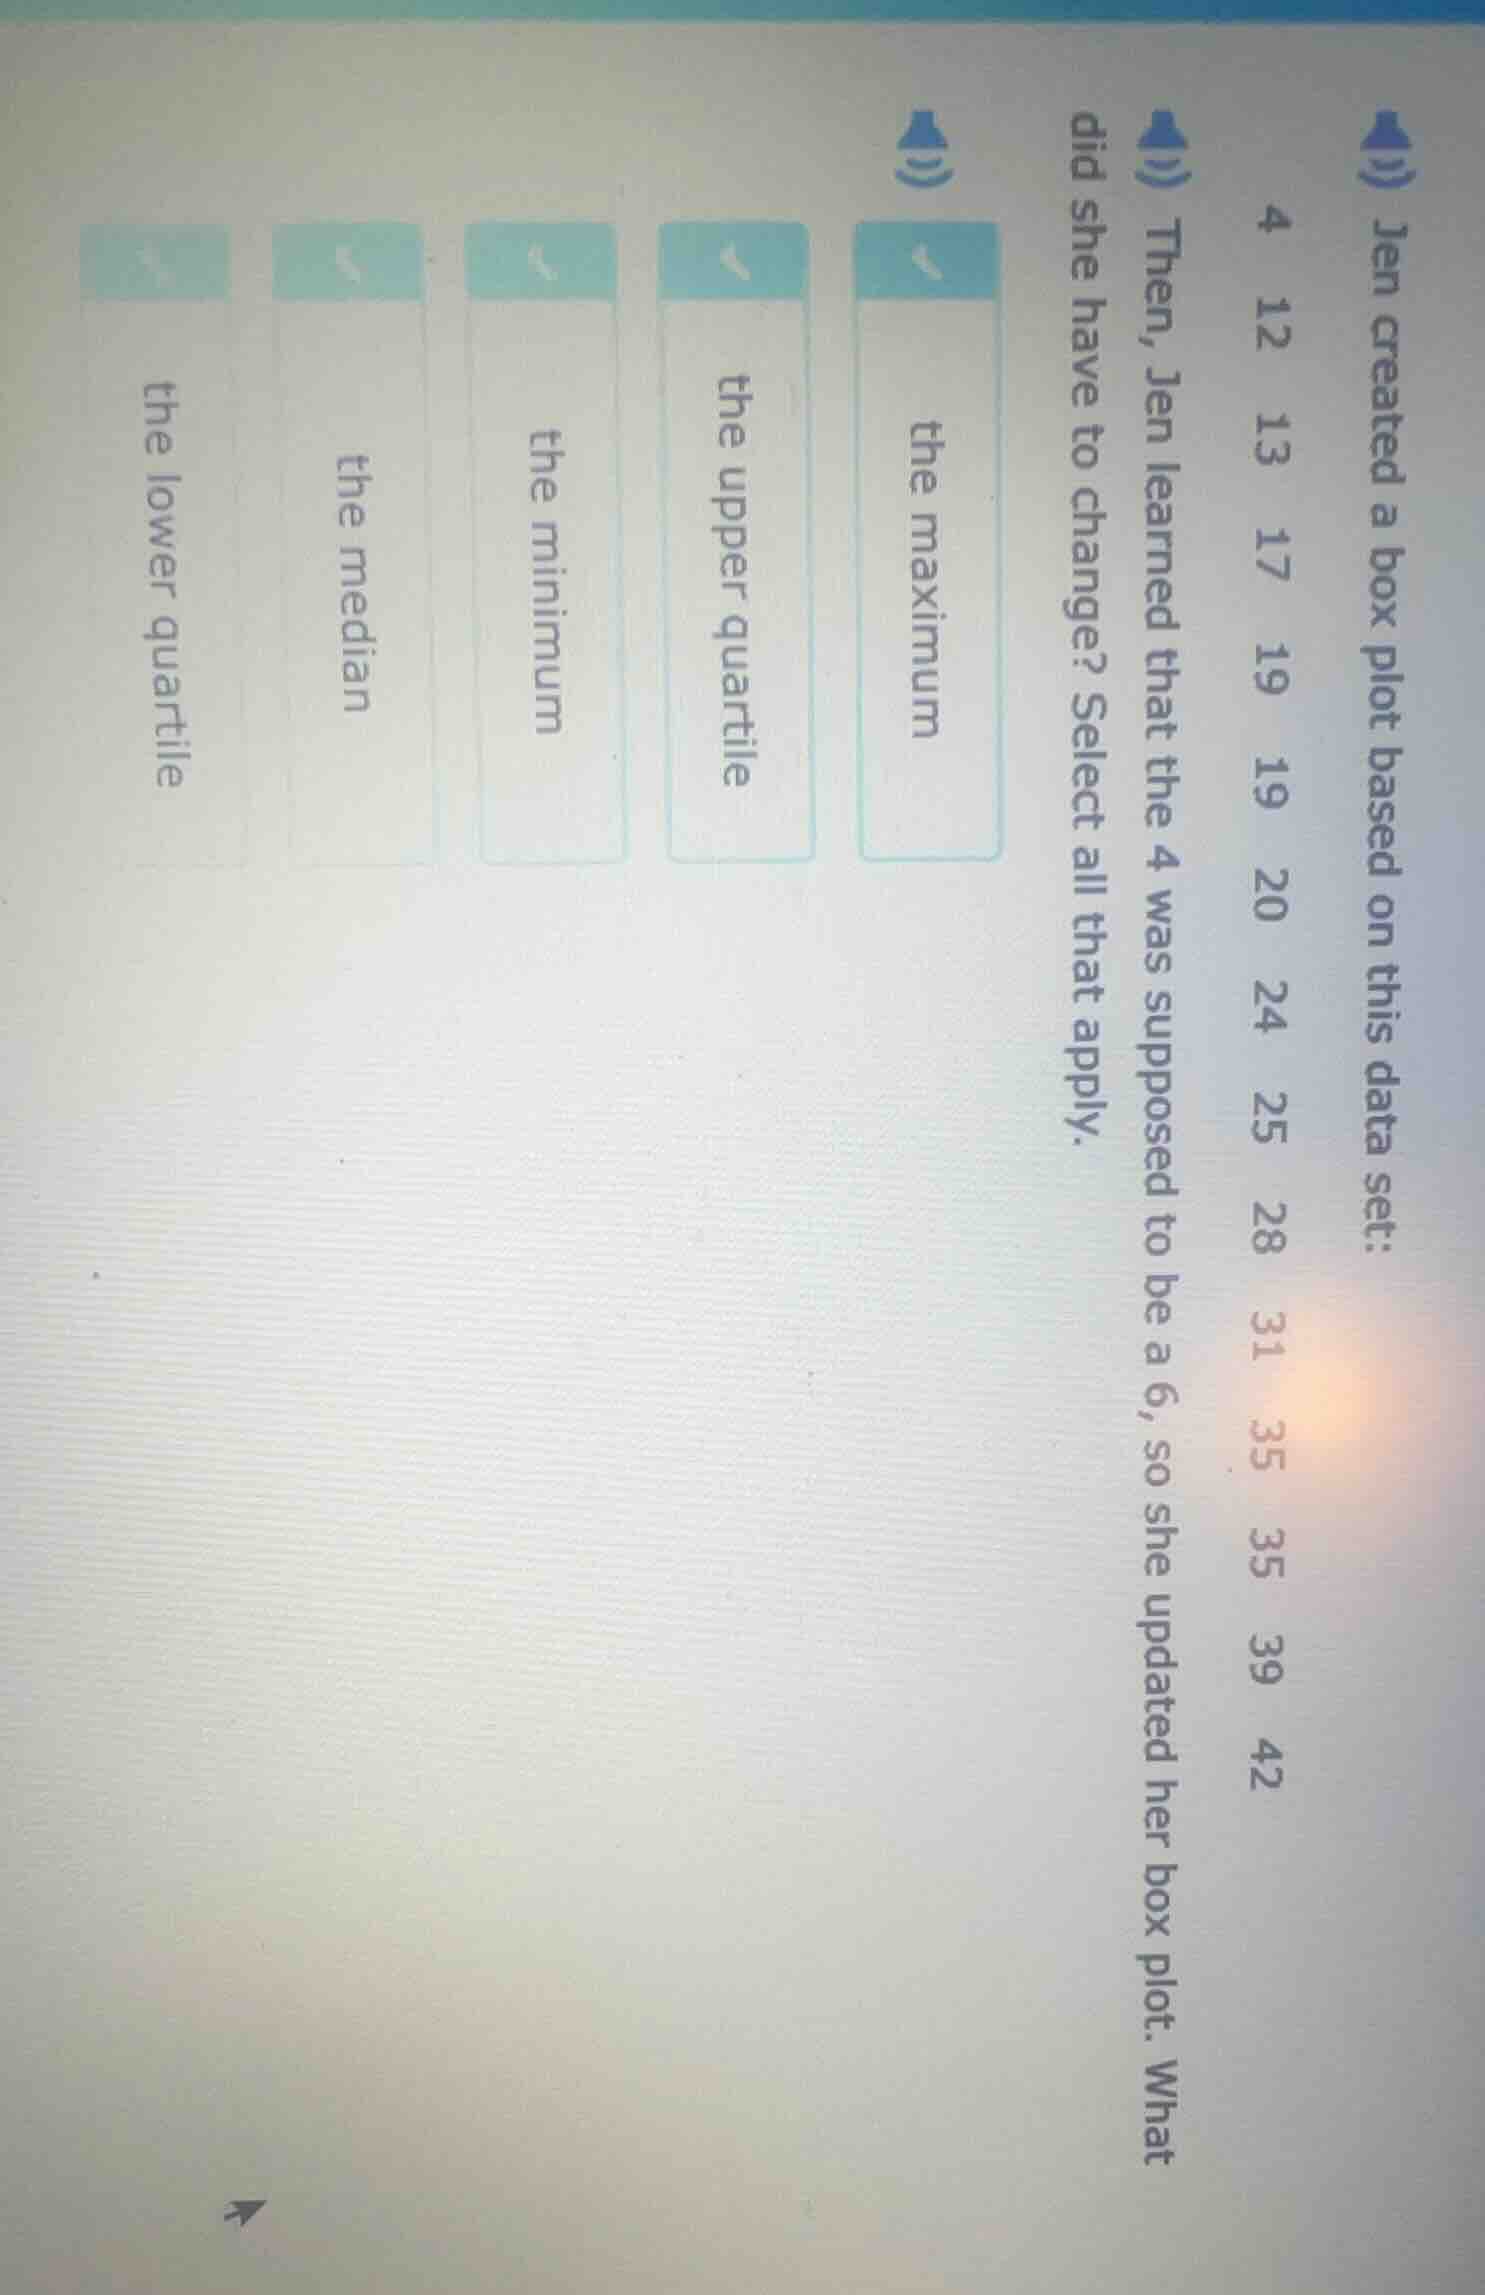
jen created a box plot based on this data set: 4 12 13 17 19 19 20 24 25 28 31 35 35 39 then, jen learned that the 4 was supposed to be a 6, so she updated her box plot. what did she have to change? select all that apply. the maximum the upper quartile the minimum the median the lower quartile
Step1: Analyze the original data set
The original data set is: \(4, 12, 13, 17, 19, 19, 20, 24, 25, 28, 31, 35, 35, 39, 42\) (15 data points). The minimum value is \(4\).
Step2: Analyze the updated data set
After changing \(4\) to \(6\), the new data set is: \(6, 12, 13, 17, 19, 19, 20, 24, 25, 28, 31, 35, 35, 39, 42\).
Step3: Check each measure
- Maximum: The maximum value was \(42\) and remains \(42\), so no change.
- Upper Quartile: The upper half of the data (after median) is for original: \(24, 25, 28, 31, 35, 35, 39, 42\) (wait, no, 15 data points, median is at 8th term (\(24\))? Wait, 15 data points: positions 1 - 15. Median is position \(\frac{15 + 1}{2}=8\), so 8th term is \(24\). Lower half: positions 1 - 7: \(4, 12, 13, 17, 19, 19, 20\) (7 data points), lower quartile (Q1) is the median of lower half, position \(\frac{7 + 1}{2}=4\), so 4th term \(17\). Upper half: positions 9 - 15: \(25, 28, 31, 35, 35, 39, 42\) (7 data points), upper quartile (Q3) is median of upper half, position \(\frac{7 + 1}{2}=4\), so 4th term \(35\).
After changing \(4\) to \(6\), lower half: \(6, 12, 13, 17, 19, 19, 20\) (7 data points), Q1 is still 4th term \(17\). Upper half remains same, so Q3 same. Median: 8th term is \(24\) in both, so median same. Minimum: original minimum \(4\), new minimum \(6\), so minimum changes. Wait, but also, the lower quartile: wait, no, the lower half is positions 1 - 7 (for 15 data points). Original lower half: \(4,12,13,17,19,19,20\) (Q1 is 4th term \(17\)). New lower half: \(6,12,13,17,19,19,20\) (Q1 is 4th term \(17\)), so lower quartile same? Wait, no, maybe I made a mistake. Wait, 15 data points: median at 8th term. Lower half: first 7 terms (positions 1 - 7), upper half: last 7 terms (positions 9 - 15). So original lower half: \(4,12,13,17,19,19,20\) (Q1 is median of these 7, which is 4th term: \(17\)). New lower half: \(6,12,13,17,19,19,20\) (Q1 is 4th term: \(17\)), so lower quartile same. Wait, but the minimum changes from \(4\) to \(6\). What about median? Median is 8th term, which is \(24\) in both, so median same. Upper quartile: upper half is positions 9 - 15: \(25,28,31,35,35,39,42\) (median is 4th term \(35\)) in both, so upper quartile same. Maximum same. Wait, but the minimum changes. Also, wait, the original minimum was \(4\), new minimum is \(6\), so the minimum changes. But also, does the lower quartile change? Wait, no, because the lower half's median (Q1) is based on the 4th term of the lower half. In original lower half, the data is \(4,12,13,17,19,19,20\). The 4th term is \(17\). In new lower half, data is \(6,12,13,17,19,19,20\). The 4th term is still \(17\), so Q1 doesn't change. Wait, but the minimum is the smallest value, so changing the smallest value from \(4\) to \(6\) will change the minimum. What about the median? The median is the middle value (8th term), which is \(24\) in both, so median doesn't change. Wait, maybe I messed up the data count. Wait, original data: let's count again. The original data: \(4,12,13,17,19,19,20,24,25,28,31,35,35,39,42\) – that's 15 numbers? Wait, \(4,12,13,17,19,19,20\) (7), \(24\) (median), \(25,28,31,35,35,39,42\) (7). Yes. So after changing \(4\) to \(6\), the lower half is \(6,12,13,17,19,19,20\) (7), median (Q1) is 4th term \(17\), same as before. So the measures that change: minimum (since the smallest value changes from \(4\) to \(6\)). Wait, but what about the options? The options are the maximum, upper quartile, minimum, median, lower quartile. Wait, maybe I made a mistake. Wait, let's list the data points again. Original d…

Snap & solve any problem in the app
Get step-by-step solutions on Sovi AI
Photo-based solutions with guided steps
Explore more problems and detailed explanations
the minimum