QUESTION IMAGE
Question
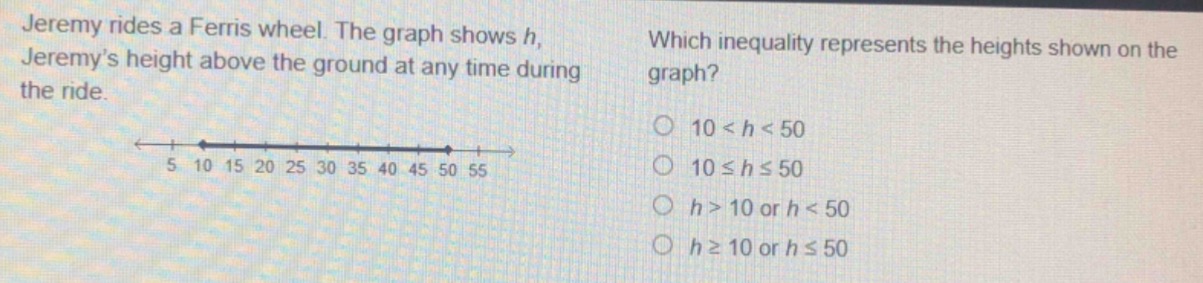
jeremy rides a ferris wheel. the graph shows h, jeremy’s height above the ground at any time during the ride. which inequality represents the heights shown on the graph? 10 < h < 50; 10 ≤ h ≤ 50; h > 10 or h < 50; h ≥ 10 or h ≤ 50
Step1: Analyze the number line
The number line has filled - in dots at 10 and 50, and the line segment is between 10 and 50. Filled - in dots on a number line graph for an inequality mean that the endpoints are included.
Step2: Determine the inequality
If the graph represents the set of all \(h\) values from 10 (inclusive) to 50 (inclusive), the inequality is \(10\leq h\leq50\). The first option \(10 < h < 50\) would have open dots (not including the endpoints), the third option \(h>10\) or \(h < 50\) represents two separate regions (not the interval between 10 and 50), and the fourth option \(h\geq10\) or \(h\leq50\) also represents two separate regions (all numbers greater than or equal to 10 or all numbers less than or equal to 50, which is the entire number line, not the interval between 10 and 50).

Snap & solve any problem in the app
Get step-by-step solutions on Sovi AI
Photo-based solutions with guided steps
Explore more problems and detailed explanations
\(10\leq h\leq50\) (corresponding to the option "10 ≤ h ≤ 50")