QUESTION IMAGE
Question
jump to level 1
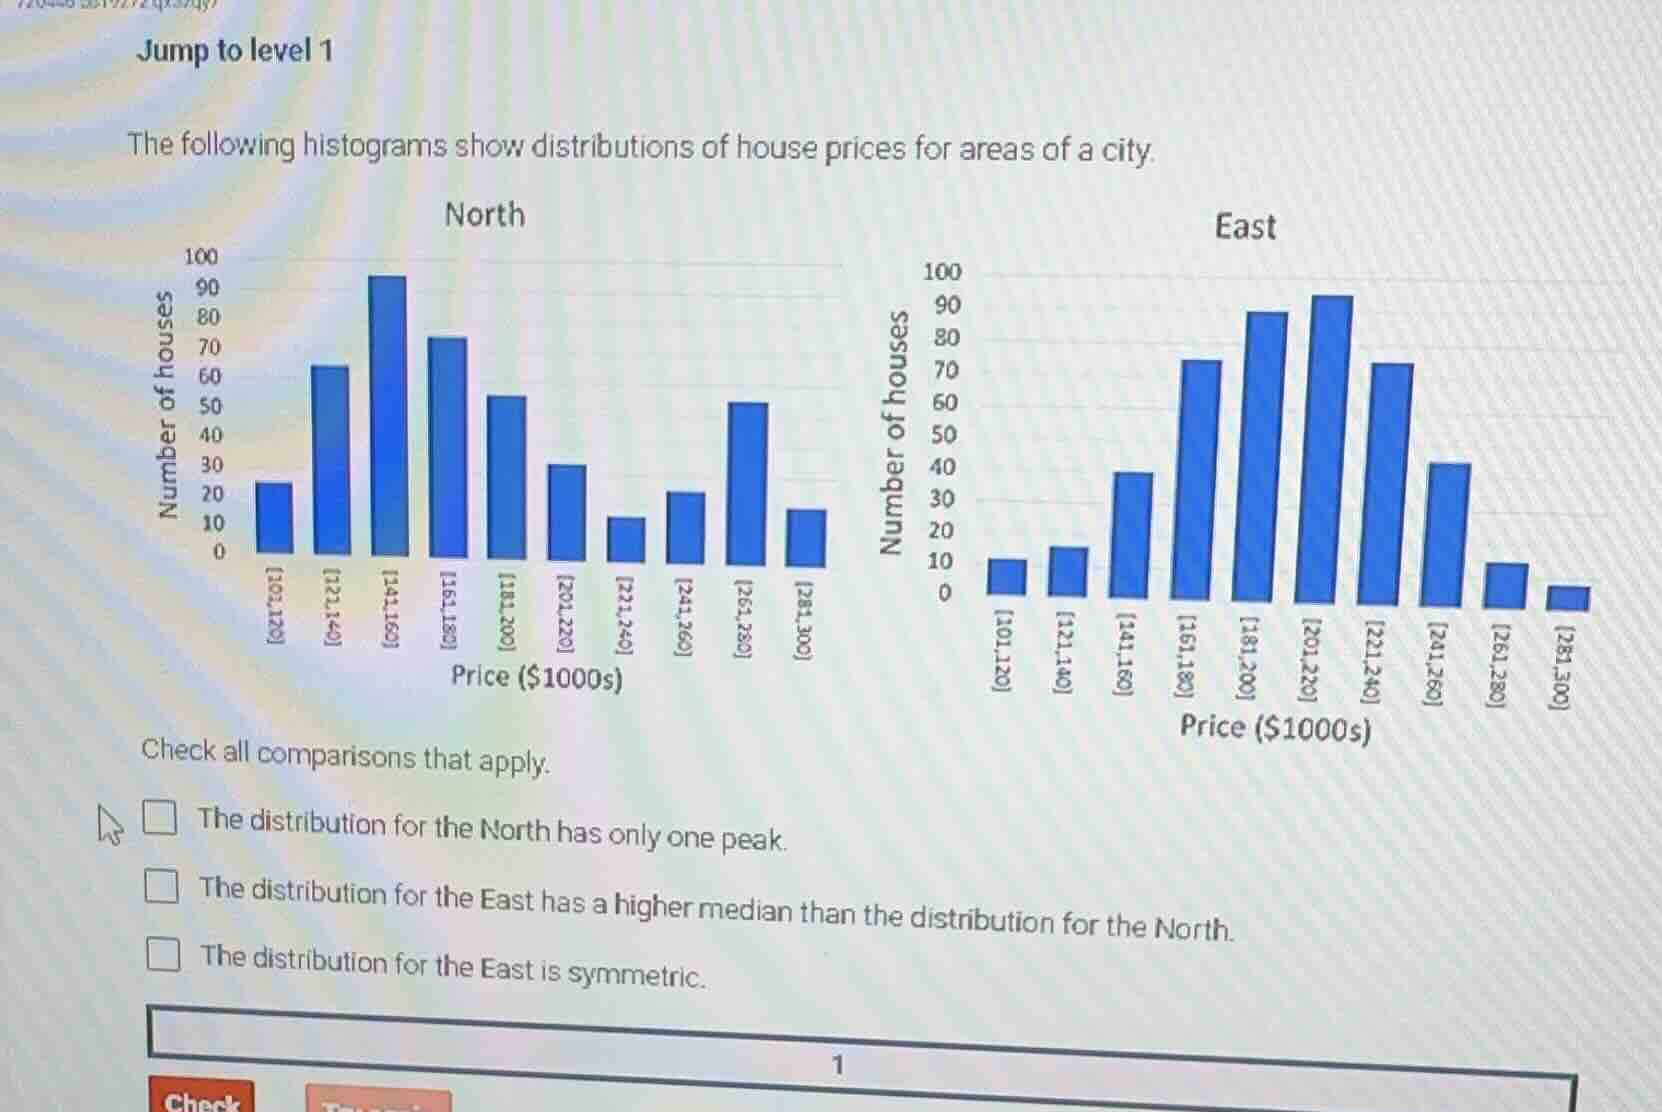
the following histograms show distributions of house prices for areas of a city.
check all comparisons that apply.
□ the distribution for the north has only one peak.
□ the distribution for the east has a higher median than the distribution for the north.
□ the distribution for the east is symmetric.
Brief Explanations
- For the North distribution: It has a peak at [141,160], and another distinct peak at [261,280], so it has two peaks, not one.
- For median comparison: The North distribution is centered around lower price bins (peaking at [141,160]), while the East distribution is centered around higher price bins (peaking at [201,220] and [181,200]). Most of East's house prices fall in higher ranges, so its median is higher than North's.
- For East distribution symmetry: The left side (lower prices) and right side (higher prices) of the peak are roughly mirror images in terms of bar heights, so the distribution is symmetric.

Snap & solve any problem in the app
Get step-by-step solutions on Sovi AI
Photo-based solutions with guided steps
Explore more problems and detailed explanations
- The distribution for the East has a higher median than the distribution for the North.
- The distribution for the East is symmetric.