QUESTION IMAGE
Question
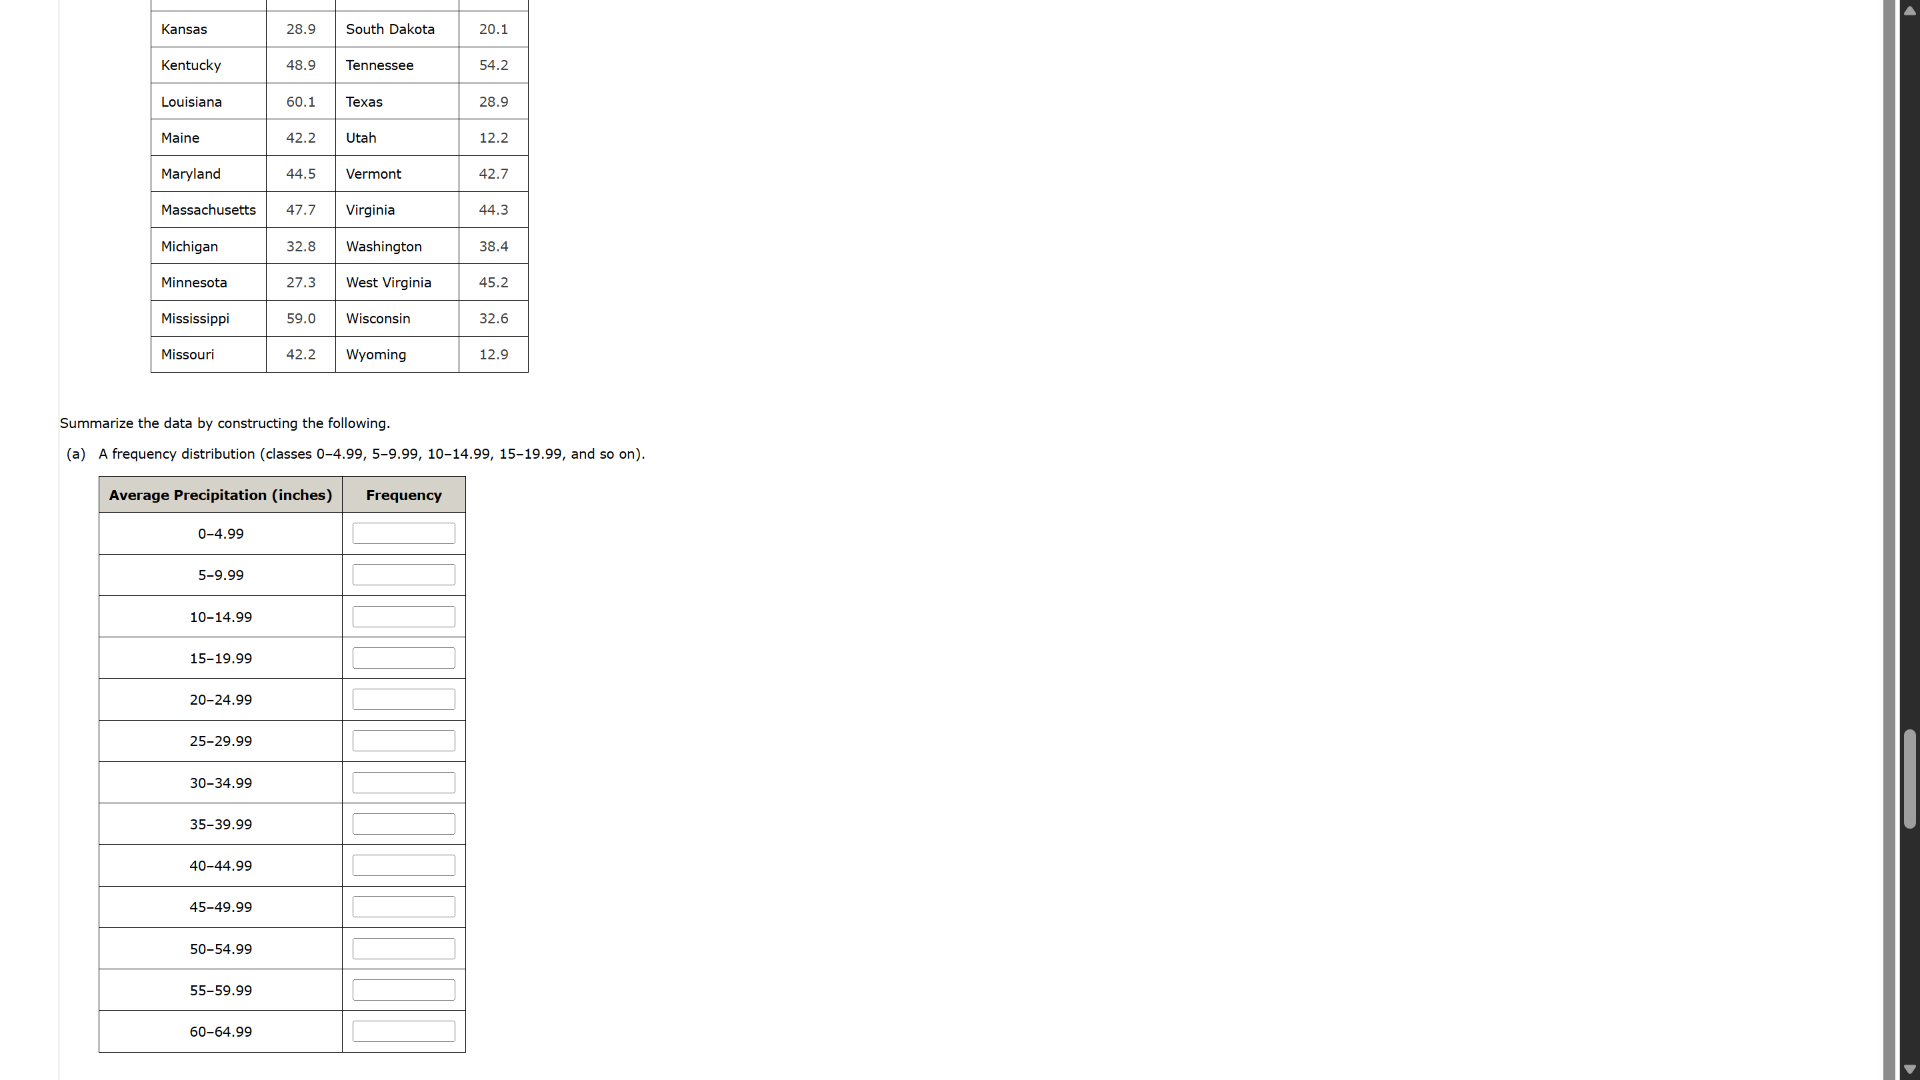
kansas 28.9 south dakota 20.1
kentucky 48.9 tennessee 54.2
louisiana 60.1 texas 28.9
maine 42.2 utah 12.2
maryland 44.5 vermont 42.7
massachusetts 47.7 virginia 44.3
michigan 32.8 washington 38.4
minnesota 27.3 west virginia 45.2
mississippi 59.0 wisconsin 32.6
missouri 42.2 wyoming 12.9
summarize the data by constructing the following.
(a) a frequency distribution (classes 0–4.99, 5–9.99, 10–14.99, 15–19.99, and so on).
average precipitation (inches) frequency
0–4.99
5–9.99
10–14.99
15–19.99
20–24.99
25–29.99
30–34.99
35–39.99
40–44.99
45–49.99
50–54.99
55–59.99
60–64.99
First, we list out all the precipitation values from the table: 28.9, 20.1, 48.9, 54.2, 60.1, 28.9, 42.2, 12.2, 44.5, 42.7, 47.7, 44.3, 32.8, 38.4, 27.3, 45.2, 59.0, 32.6, 42.2, 12.9.
Step 1: Count for 0 - 4.99
Check which values are in [0, 4.99). None of the values are in this range. So frequency = 0.
Step 2: Count for 5 - 9.99
Check which values are in [5, 9.99). None of the values are in this range. So frequency = 0.
Step 3: Count for 10 - 14.99
Values in [10, 14.99): 12.2, 12.9. So frequency = 2.
Step 4: Count for 15 - 19.99
Check which values are in [15, 19.99). None of the values are in this range. So frequency = 0.
Step 5: Count for 20 - 24.99
Value in [20, 24.99): 20.1, 27.3? Wait, 27.3 is in 25 - 29.99. Wait, 20.1 is in [20,24.99), 27.3 is in 25 - 29.99. So 20.1 is one. Wait, 27.3: 27.3 is between 25 and 29.99. So 20.1 is in 20 - 24.99. So frequency = 1 (only 20.1? Wait no, 27.3 is 27.3, which is 25 - 29.99. Wait 20.1 is 20.1, which is in 20 - 24.99. Any others? 28.9 is 28.9 (25 - 29.99), 27.3 (25 - 29.99), 20.1 (20 - 24.99). Wait, let's re - check all values:
28.9: 25 - 29.99
20.1: 20 - 24.99
48.9: 45 - 49.99
54.2: 50 - 54.99
60.1: 60 - 64.99
28.9: 25 - 29.99
42.2: 40 - 44.99
12.2: 10 - 14.99
44.5: 40 - 44.99
42.7: 40 - 44.99
47.7: 45 - 49.99
44.3: 40 - 44.99
32.8: 30 - 34.99
38.4: 35 - 39.99
27.3: 25 - 29.99
45.2: 45 - 49.99
59.0: 55 - 59.99
32.6: 30 - 34.99
42.2: 40 - 44.99
12.9: 10 - 14.99
So 20 - 24.99: only 20.1. So frequency = 1.
Step 6: Count for 25 - 29.99
Values: 28.9, 28.9, 27.3. So frequency = 3.
Step 7: Count for 30 - 34.99
Values: 32.8, 32.6. So frequency = 2.
Step 8: Count for 35 - 39.99
Value: 38.4. So frequency = 1.
Step 9: Count for 40 - 44.99
Values: 42.2, 44.5, 42.7, 44.3, 42.2. Let's count: 42.2 (1), 44.5 (2), 42.7 (3), 44.3 (4), 42.2 (5). So frequency = 5.
Step 10: Count for 45 - 49.99
Values: 48.9, 47.7, 45.2. So frequency = 3.
Step 11: Count for 50 - 54.99
Value: 54.2. So frequency = 1.
Step 12: Count for 55 - 59.99
Value: 59.0. So frequency = 1.
Step 13: Count for 60 - 64.99
Value: 60.1. So frequency = 1.
Now we can fill the frequency table:
| Average Precipitation (inches) | Frequency |
|---|---|
| 5 - 9.99 | 0 |
| 10 - 14.99 | 2 |
| 15 - 19.99 | 0 |
| 20 - 24.99 | 1 |
| 25 - 29.99 | 3 |
| 30 - 34.99 | 2 |
| 35 - 39.99 | 1 |
| 40 - 44.99 | 5 |
| 45 - 49.99 | 3 |
| 50 - 54.99 | 1 |
| 55 - 59.99 | 1 |
| 60 - 64.99 | 1 |

Snap & solve any problem in the app
Get step-by-step solutions on Sovi AI
Photo-based solutions with guided steps
Explore more problems and detailed explanations
The frequency distribution table is as follows:
| Average Precipitation (inches) | Frequency |
|---|---|
| 5 - 9.99 | 0 |
| 10 - 14.99 | 2 |
| 15 - 19.99 | 0 |
| 20 - 24.99 | 1 |
| 25 - 29.99 | 3 |
| 30 - 34.99 | 2 |
| 35 - 39.99 | 1 |
| 40 - 44.99 | 5 |
| 45 - 49.99 | 3 |
| 50 - 54.99 | 1 |
| 55 - 59.99 | 1 |
| 60 - 64.99 | 1 |