QUESTION IMAGE
Question
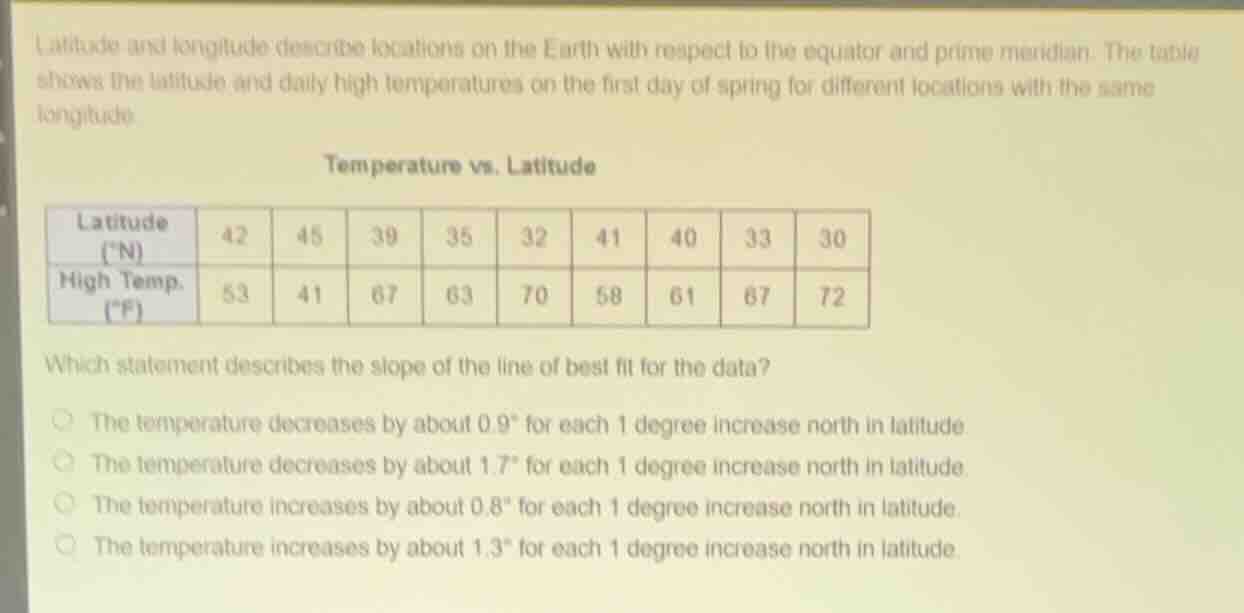
latitude and longitude describe locations on the earth with respect to the equator and prime meridian. the table shows the latitude and daily high temperatures on the first day of spring for different locations with the same longitude.
temperature vs. latitude
| latitude (°n) | 42 | 45 | 39 | 35 | 32 | 41 | 40 | 33 | 30 |
| high temp. (°f) | 53 | 41 | 67 | 63 | 70 | 58 | 61 | 67 | 72 |
which statement describes the slope of the line of best fit for the data?
- the temperature decreases by about 0.9° for each 1 degree increase north in latitude
- the temperature decreases by about 1.7° for each 1 degree increase north in latitude
- the temperature increases by about 0.8° for each 1 degree increase north in latitude
- the temperature increases by about 1.3° for each 1 degree increase north in latitude
To determine the slope of the line of best fit, we can use the concept of the slope in a linear relationship (slope = change in y / change in x, where y is temperature and x is latitude). We can also use a calculator or software to find the regression line, but we can estimate the trend.
Step 1: Analyze the Trend
As latitude (x) increases (moving north), the high temperature (y) generally decreases. So the slope should be negative (indicating a decrease).
Step 2: Calculate the Slope (Approximate)
We can use two points to approximate the slope. Let's take the first and last points:
- Point 1: (30, 72) (latitude 30, temp 72)
- Point 2: (45, 41) (latitude 45, temp 41)
Slope \( m = \frac{y_2 - y_1}{x_2 - x_1} = \frac{41 - 72}{45 - 30} = \frac{-31}{15} \approx -2.07 \). But this is a rough estimate. Using more points or a regression line, we can get a better estimate.
Alternatively, using the concept of the line of best fit, we can calculate the slope using the formula for the slope of a regression line:
\( m = \frac{n\sum(xy) - \sum x \sum y}{n\sum(x^2) - (\sum x)^2} \)
First, let's list the data:
| Latitude (x) | High Temp (y) | xy | x² |
|---|---|---|---|
| 45 | 41 | 45*41 = 1845 | 45² = 2025 |
| 39 | 67 | 39*67 = 2613 | 39² = 1521 |
| 35 | 63 | 35*63 = 2205 | 35² = 1225 |
| 32 | 70 | 32*70 = 2240 | 32² = 1024 |
| 41 | 58 | 41*58 = 2378 | 41² = 1681 |
| 40 | 61 | 40*61 = 2440 | 40² = 1600 |
| 33 | 67 | 33*67 = 2211 | 33² = 1089 |
| 30 | 72 | 30*72 = 2160 | 30² = 900 |
Now, calculate the sums:
- \( n = 9 \)
- \( \sum x = 42 + 45 + 39 + 35 + 32 + 41 + 40 + 33 + 30 = 337 \)
- \( \sum y = 53 + 41 + 67 + 63 + 70 + 58 + 61 + 67 + 72 = 552 \)
- \( \sum xy = 2226 + 1845 + 2613 + 2205 + 2240 + 2378 + 2440 + 2211 + 2160 = 20318 \)
- \( \sum x^2 = 1764 + 2025 + 1521 + 1225 + 1024 + 1681 + 1600 + 1089 + 900 = 12829 \)
Now, plug into the slope formula:
\( m = \frac{920318 - 337552}{9*12829 - (337)^2} \)
Calculate numerator:
\( 9*20318 = 182862 \)
\( 337*552 = 337*500 + 337*52 = 168500 + 17524 = 186024 \)
Numerator: \( 182862 - 186024 = -3162 \)
Denominator:
\( 9*12829 = 115461 \)
\( 337^2 = 113569 \)
Denominator: \( 115461 - 113569 = 1892 \)
Slope \( m = \frac{-3162}{1892} \approx -1.67 \approx -1.7 \)
So the temperature decreases by about 1.7° for each 1 degree increase north in latitude.

Snap & solve any problem in the app
Get step-by-step solutions on Sovi AI
Photo-based solutions with guided steps
Explore more problems and detailed explanations
The temperature decreases by about 1.7° for each 1 degree increase north in latitude (the second option).