QUESTION IMAGE
Question
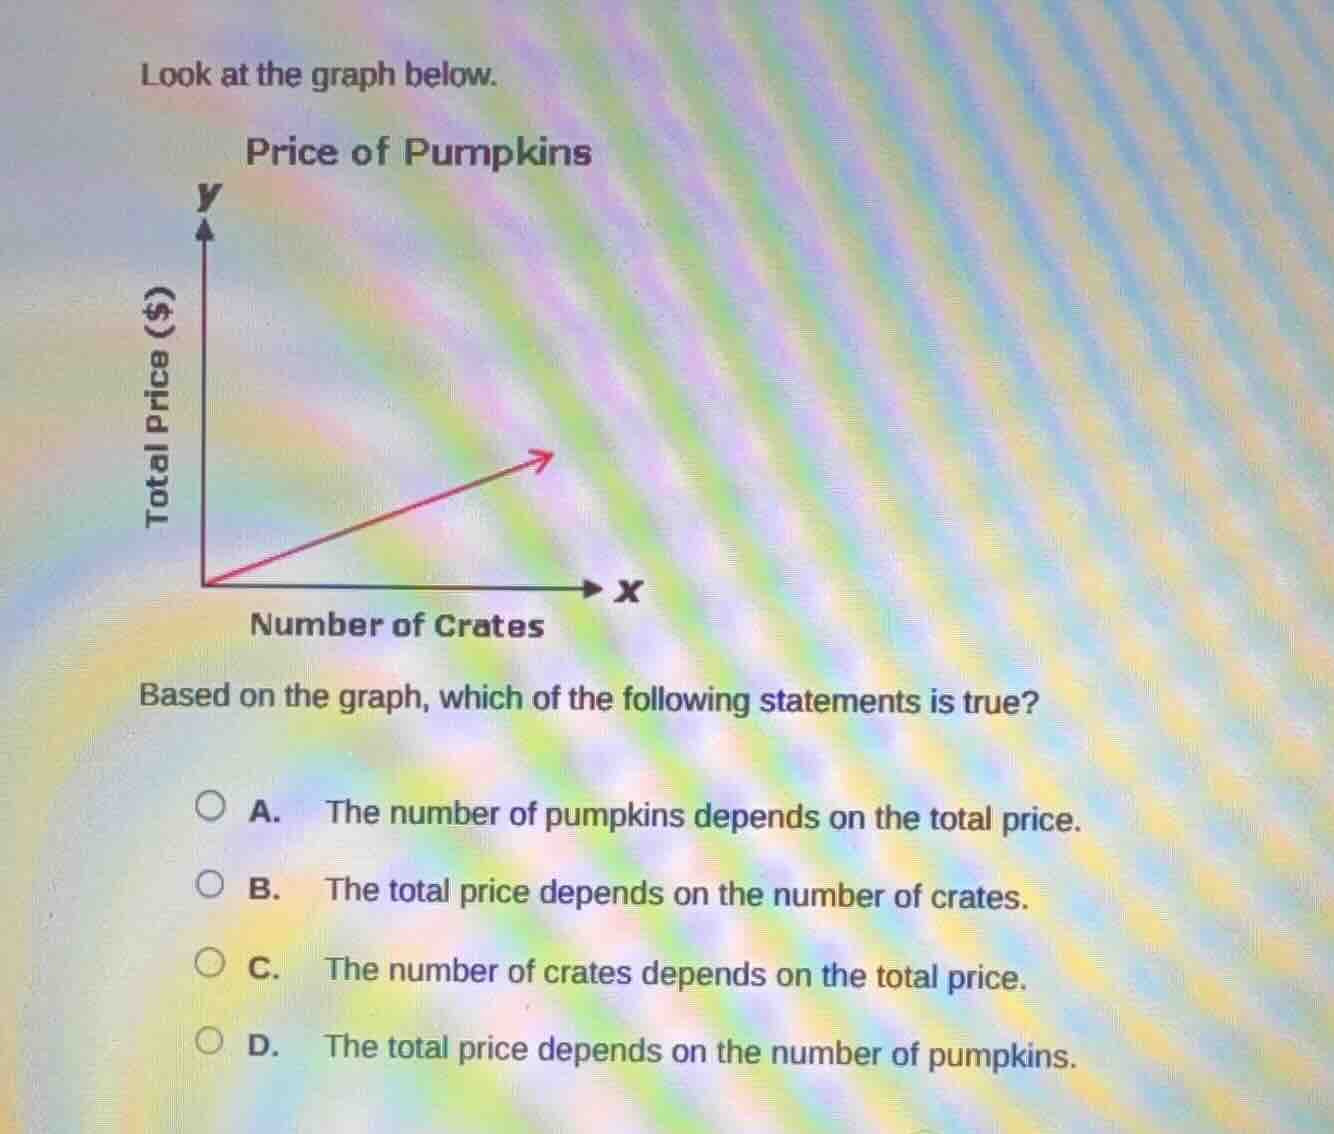
look at the graph below.
price of pumpkins
total price ($) is on the y - axis, number of crates is on the x - axis. the graph is a straight line starting from the origin and going up to the right.
based on the graph, which of the following statements is true?
a. the number of pumpkins depends on the total price.
b. the total price depends on the number of crates.
c. the number of crates depends on the total price.
d. the total price depends on the number of pumpkins.
The graph has the x - axis as the number of crates and the y - axis as the total price. In a graph, the dependent variable (y - axis) depends on the independent variable (x - axis). Here, total price (y) is on the y - axis and number of crates (x) is on the x - axis. So the total price depends on the number of crates. Option A is incorrect as the graph does not show a relationship between number of pumpkins and total price. Option C is incorrect because the number of crates (x - axis, independent) does not depend on total price (y - axis, dependent). Option D is incorrect as the graph does not show a relationship between number of pumpkins and total price.

Snap & solve any problem in the app
Get step-by-step solutions on Sovi AI
Photo-based solutions with guided steps
Explore more problems and detailed explanations
B. The total price depends on the number of crates.