QUESTION IMAGE
Question
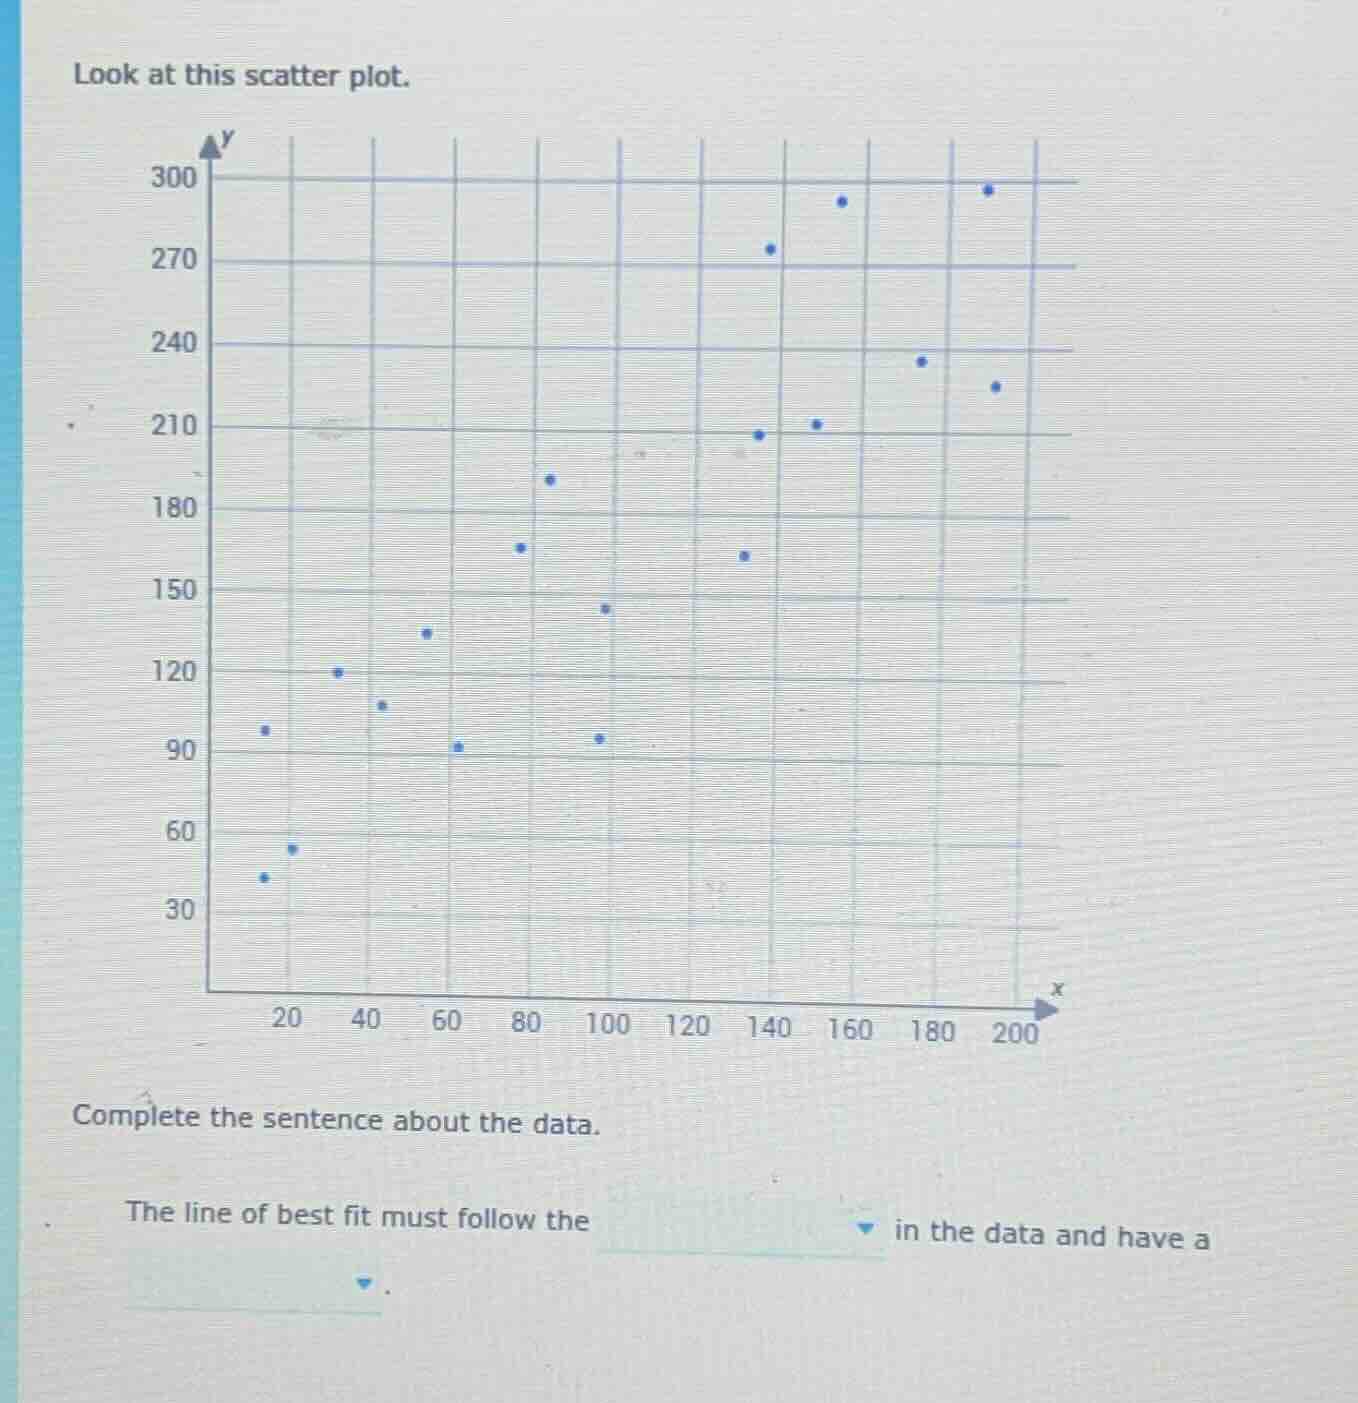
look at this scatter plot.
complete the sentence about the data.
the line of best fit must follow the
in the data and have a
.
Brief Explanations
To determine the blanks, we analyze the scatter plot. The line of best fit follows the trend (pattern) in the data. Observing the plot, as \( x \) increases, \( y \) generally increases, so the slope is positive.

Snap & solve any problem in the app
Get step-by-step solutions on Sovi AI
Photo-based solutions with guided steps
Explore more problems and detailed explanations
The line of best fit must follow the \(\boldsymbol{\text{trend}}\) in the data and have a \(\boldsymbol{\text{positive slope}}\).