QUESTION IMAGE
Question
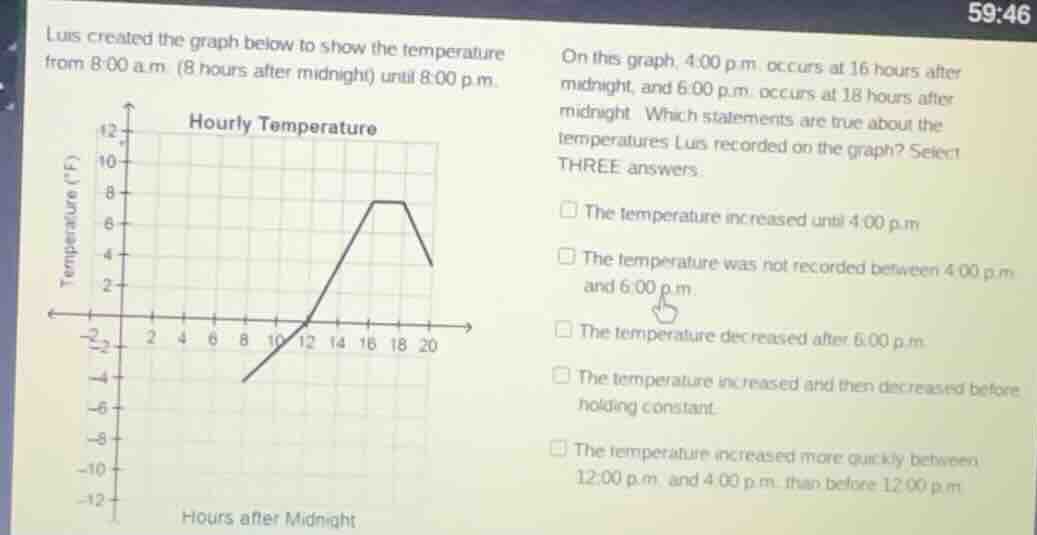
luis created the graph below to show the temperature from 8:00 a.m. (8 hours after midnight) until 8:00 p.m.hourly temperatureon this graph, 4:00 p.m. occurs at 16 hours after midnight, and 6:00 p.m. occurs at 18 hours after midnight. which statements are true about the temperatures lus recorded on the graph? select three answers.□ the temperature increased until 4:00 p.m.□ the temperature was not recorded between 4:00 p.m. and 6:00 p.m.□ the temperature decreased after 6:00 p.m.□ the temperature increased and then decreased before holding constant.□ the temperature increased more quickly between 12:00 p.m. and 4:00 p.m. than before 12:00 p.m.
- Check temperature trend until 4:00 p.m. (16 hours): The graph shows temperature rises from before 12 hours (12 p.m.) up to 16 hours, so this statement is true.
- Check recording between 4:00 p.m. (16h) and 6:00 p.m. (18h): The graph has a flat line between 16 and 18 hours, meaning temperature was recorded as constant, so this statement is false.
- Check trend after 6:00 p.m. (18 hours): The graph slopes downward after 18 hours, so temperature decreased, making this statement true.
- Check overall early trend: The graph first rises (increases), stays flat (constant), then falls (decreases), so this statement is true.
- Check rate of increase: Before 12 p.m. (12 hours), the line has a gentle slope; between 12 p.m. and 4 p.m. (12-16 hours), the line is much steeper, meaning faster increase, so this statement is true.
We need to select three true statements.

Snap & solve any problem in the app
Get step-by-step solutions on Sovi AI
Photo-based solutions with guided steps
Explore more problems and detailed explanations
A. The temperature increased until 4:00 p.m.
C. The temperature decreased after 6:00 p.m.
D. The temperature increased and then decreased before holding constant.