QUESTION IMAGE
Question
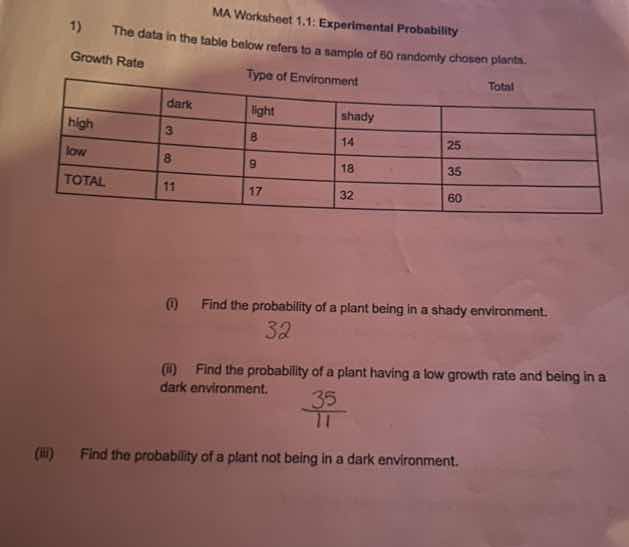
ma worksheet 1.1: experimental probability
- the data in the table below refers to a sample of 60 randomly chosen plants.
growth rate type of environment total
dark light shady
high 3 8 14 25
low 8 9 18 35
total 11 17 32 60
(i) find the probability of a plant being in a shady environment.
(ii) find the probability of a plant having a low growth rate and being in a dark environment.
(iii) find the probability of a plant not being in a dark environment.
Step1: Identify total and shady plants
Total plants = 60, shady plants = 32. Probability is $\frac{\text{shady plants}}{\text{total plants}}$.
$\frac{32}{60} = \frac{8}{15}$
Step2: Identify low growth + dark plants
Plants with low growth and dark environment = 8. Probability is $\frac{\text{target plants}}{\text{total plants}}$.
$\frac{8}{60} = \frac{2}{15}$
Step3: Calculate non-dark environment plants
Non-dark plants = Total plants - dark plants = $60 - 11 = 49$. Probability is $\frac{\text{non-dark plants}}{\text{total plants}}$.
$\frac{49}{60}$

Snap & solve any problem in the app
Get step-by-step solutions on Sovi AI
Photo-based solutions with guided steps
Explore more problems and detailed explanations
(i) $\frac{8}{15}$
(ii) $\frac{2}{15}$
(iii) $\frac{49}{60}$