QUESTION IMAGE
Question
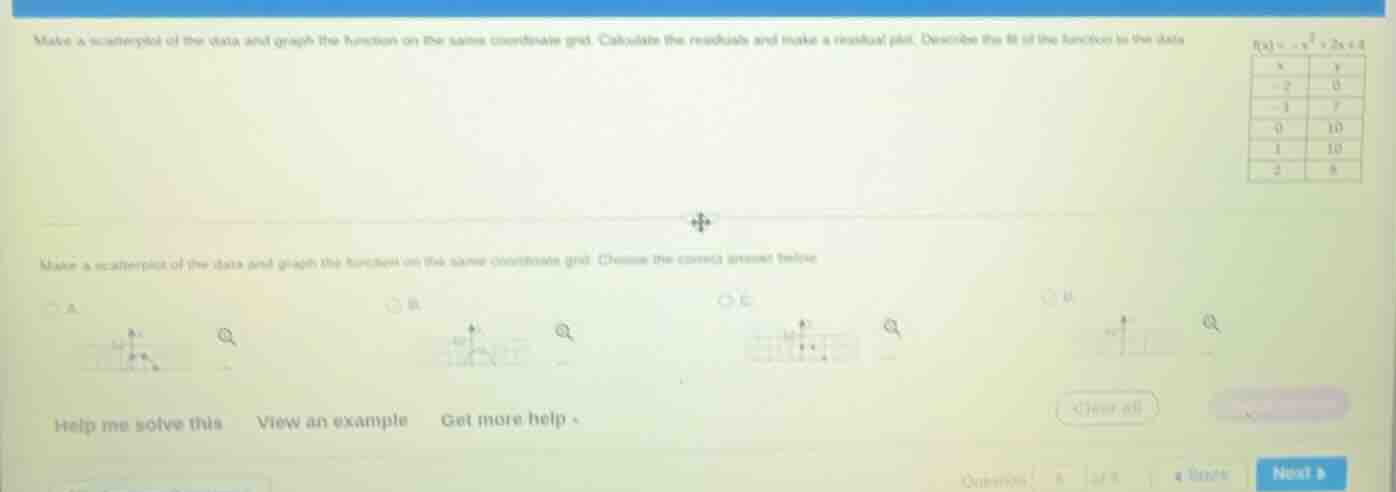
make a scatterplot of the data and graph the function on the same coordinate grid. calculate the residuals and make a residual plot. describe the fit of the function to the data. ( f(x) = -x^2 + 2x + 8 )
| x | y |
| -2 | 0 |
| -1 | 7 |
| 0 | 10 |
| 1 | 10 |
| 2 | 8 |
make a scatterplot of the data and graph the function on the same coordinate grid. choose the correct answer below.
a.
b.
c.
d.
help me solve this view an example get more help .
clear all
question 5 of 8
next >
Step1: Calculate function values
For each $x$, compute $\hat{y}=-x^2+2x+8$:
- $x=-2$: $\hat{y}=-(-2)^2+2(-2)+8=-4-4+8=0$
- $x=-1$: $\hat{y}=-(-1)^2+2(-1)+8=-1-2+8=7$
- $x=0$: $\hat{y}=-(0)^2+2(0)+8=8$
- $x=1$: $\hat{y}=-(1)^2+2(1)+8=-1+2+8=9$
- $x=2$: $\hat{y}=-(2)^2+2(2)+8=-4+4+8=8$
Step2: Compute residuals
Residual = $y-\hat{y}$ (actual - predicted):
- $x=-2$: $0-0=0$
- $x=-1$: $7-7=0$
- $x=0$: $10-8=2$
- $x=1$: $10-9=1$
- $x=2$: $8-8=0$
Step3: Assess function fit
Residuals are small (0, 0, 2, 1, 0) with no clear pattern, meaning the function aligns closely with the data points, so it is a very good fit.
To select the correct plot: confirm the data points are plotted, and the parab[LLM SSE On Failure]

Snap & solve any problem in the app
Get step-by-step solutions on Sovi AI
Photo-based solutions with guided steps
Explore more problems and detailed explanations
First, we identify the correct scatterplot + function graph (note: since the option images are not fully visible, we first calculate the function values, then residuals, then assess fit):
- Correct plot will have data points (-2,0), (-1,7), (0,10), (1,10), (2,8) and the curve $y=-x^2+2x+8$
- Residuals: $-1, 0, 2, 1, 0$
- The function is a very good fit to the data.