QUESTION IMAGE
Question
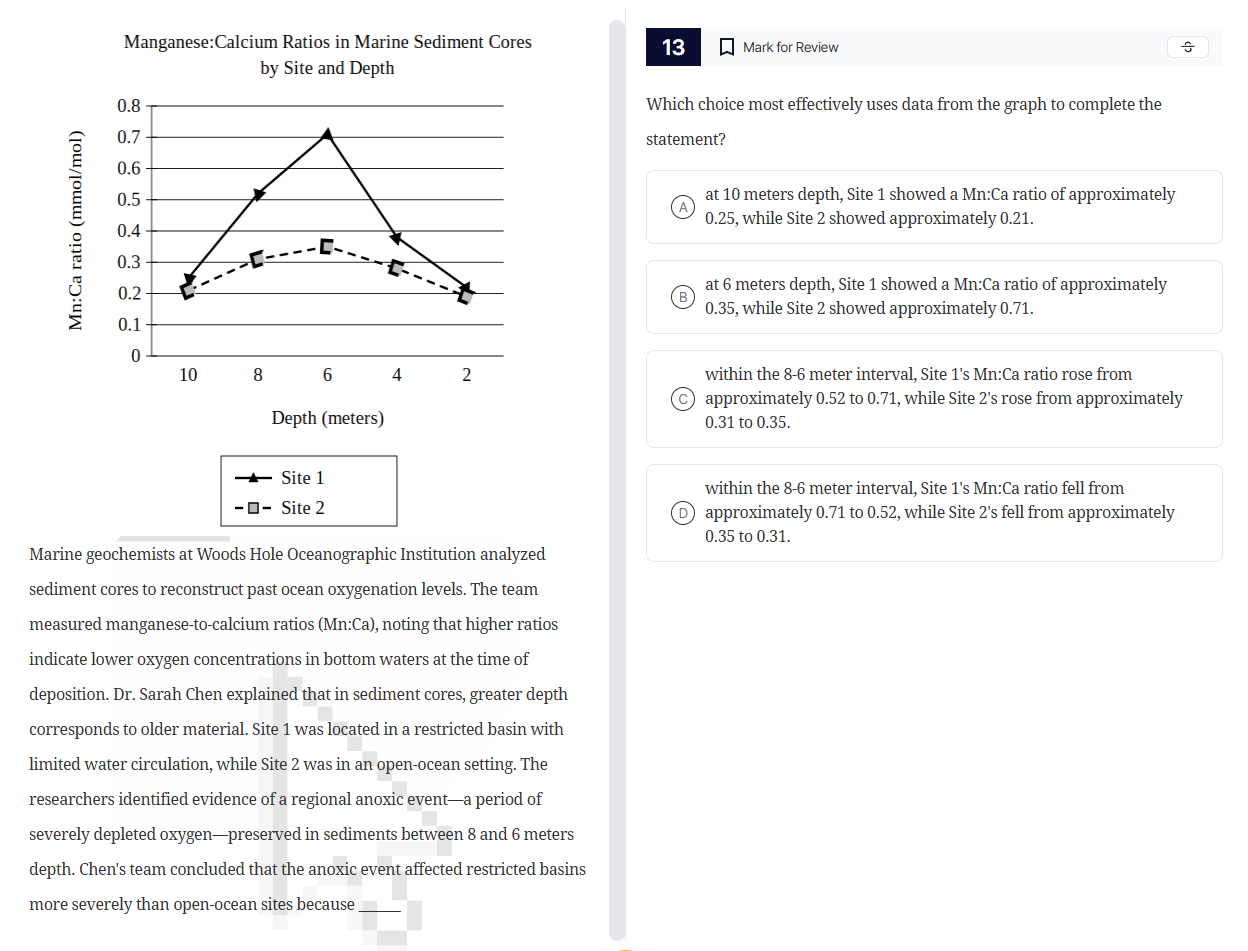
manganese:calcium ratios in marine sediment cores by site and depth marine geochemists at woods hole oceanographic institution analyzed sediment cores to reconstruct past ocean oxygenation levels. the team measured manganese - to - calcium ratios (mn:ca), noting that higher ratios indicate lower oxygen concentrations in bottom waters at the time of deposition. dr. sarah chen explained that in sediment cores, greater depth corresponds to older material. site 1 was located in a restricted basin with limited water circulation, while site 2 was in an open - ocean setting. the researchers identified evidence of a regional anoxic event—a period of severely depleted oxygen—preserved in sediments between 8 and 6 meters depth. chens team concluded that the anoxic event affected restricted basins more severely than open - ocean sites because
13
which choice most effectively uses data from the graph to complete the statement?
a at 10 meters depth, site 1 showed a mn:ca ratio of approximately 0.25, while site 2 showed approximately 0.21.
b at 6 meters depth, site 1 showed a mn:ca ratio of approximately 0.35, while site 2 showed approximately 0.71.
c within the 8 - 6 meter interval, site 1s mn:ca ratio rose from approximately 0.52 to 0.71, while site 2s rose from approximately 0.31 to 0.35.
d within the 8 - 6 meter interval, site 1s mn:ca ratio fell from approximately 0.71 to 0.52, while site 2s fell from approximately 0.35 to 0.31.
- Option A: At 10 meters depth, Site 1's ratio is ~0.25? No, the graph shows Site 1 at 10m is ~0.2 (the black diamond), Site 2 (grey square) is ~0.2. So A is wrong.
- Option B: At 6 meters depth, Site 1's ratio: the black diamond at 6m is ~0.7, Site 2 (grey square) is ~0.35. So B says Site 2 is ~0.71, which is wrong.
- Option C: Within 8 - 6 meter interval (depth decreases from 8 to 6, so moving from 8m to 6m on the x - axis). Site 1: at 8m, black diamond is ~0.52; at 6m, ~0.71. Site 2: at 8m, grey square is ~0.31; at 6m, ~0.35. So the ratios rose for both, and Site 1's rise is larger (matches the anoxic event affecting restricted basins (Site 1) more). This fits.
- Option D: Says ratios fell, but from 8 to 6m (decreasing depth, older to younger? Wait, depth: 10,8,6,4,2 – so 10m is deeper (older), 2m is shallower (younger). So 8 - 6m: depth decreases (from 8 to 6, moving left to right? Wait, x - axis is depth (meters), with 10,8,6,4,2 – so 10 is left, 2 is right. So moving from 8 (x = 8) to 6 (x = 6) is moving left to right? Wait, no, 10 is deeper (higher depth value), 2 is shallower (lower depth value). So the x - axis is labeled "Depth (meters)" with 10,8,6,4,2 – so 10m is the deepest (leftmost), 2m is the shallowest (rightmost). So when moving from 8m (x = 8) to 6m (x = 6), we are moving to a shallower depth (since 6 < 8). Now, Site 1's data: at 8m (x = 8), black diamond is ~0.52; at 6m (x = 6), black diamond is ~0.71. So the ratio increased, not decreased. So D says "fell", which is wrong.

Snap & solve any problem in the app
Get step-by-step solutions on Sovi AI
Photo-based solutions with guided steps
Explore more problems and detailed explanations
C. within the 8 - 6 meter interval, Site 1's Mn:Ca ratio rose from approximately 0.52 to 0.71, while Site 2's rose from approximately 0.31 to 0.35.