QUESTION IMAGE
Question
5
mark for review
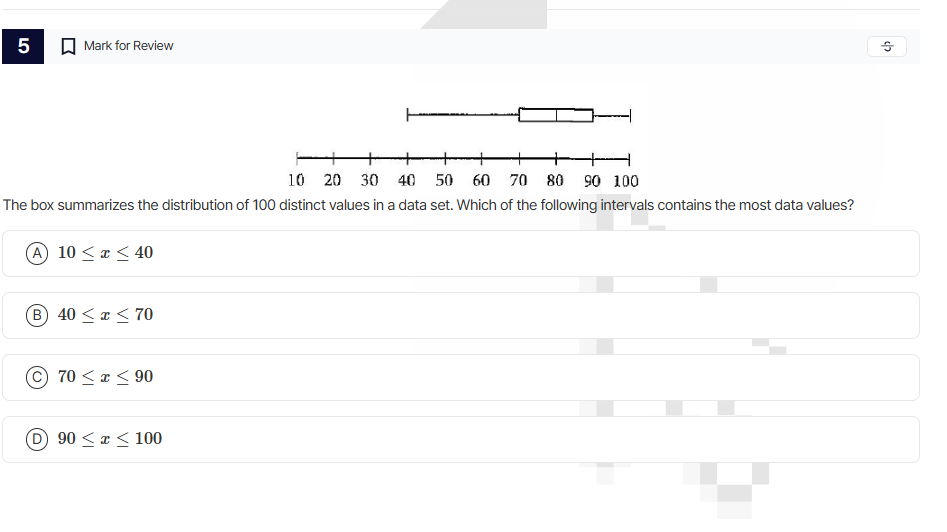
the box summarizes the distribution of 100 distinct values in a data set. which of the following intervals contains the most data values?
a ( 10 leq x leq 40 )
b ( 40 leq x leq 70 )
c ( 70 leq x leq 90 )
d ( 90 leq x leq 100 )
Brief Explanations
A box - plot (box - and - whisker plot) shows the distribution of data. The box represents the inter - quartile range (IQR), which contains about 50% of the data, and the whiskers represent the remaining data. Also, we know that in a data set with 100 distinct values, we can think about the spread of data.
- For option A: The interval \(10\leq x\leq40\) is in the left - hand side of the box - plot. From the number line, we can see that this interval is outside the main cluster of the box. Visually, the length of the whisker or the area of data points in this interval is relatively small.
- For option B: The interval \(40\leq x\leq70\) includes the left - hand part of the box and the area from 40 to 70. Since the box contains about 50% of the data and the left - hand part of the box (from 40 to the median or lower quartile) along with the area up to 70 will have a large number of data points.
- For option C: The interval \(70\leq x\leq90\) is the box part (the middle 50% or a part of it), but it is a smaller interval compared to the interval from 40 to 70 in terms of the spread of data.
- For option D: The interval \(90\leq x\leq100\) is the right - hand whisker, which contains a relatively small number of data points (usually less than 25% of the data as it is a whisker, not the box).

Snap & solve any problem in the app
Get step-by-step solutions on Sovi AI
Photo-based solutions with guided steps
Explore more problems and detailed explanations
B. \(40\leq x\leq70\)