QUESTION IMAGE
Question
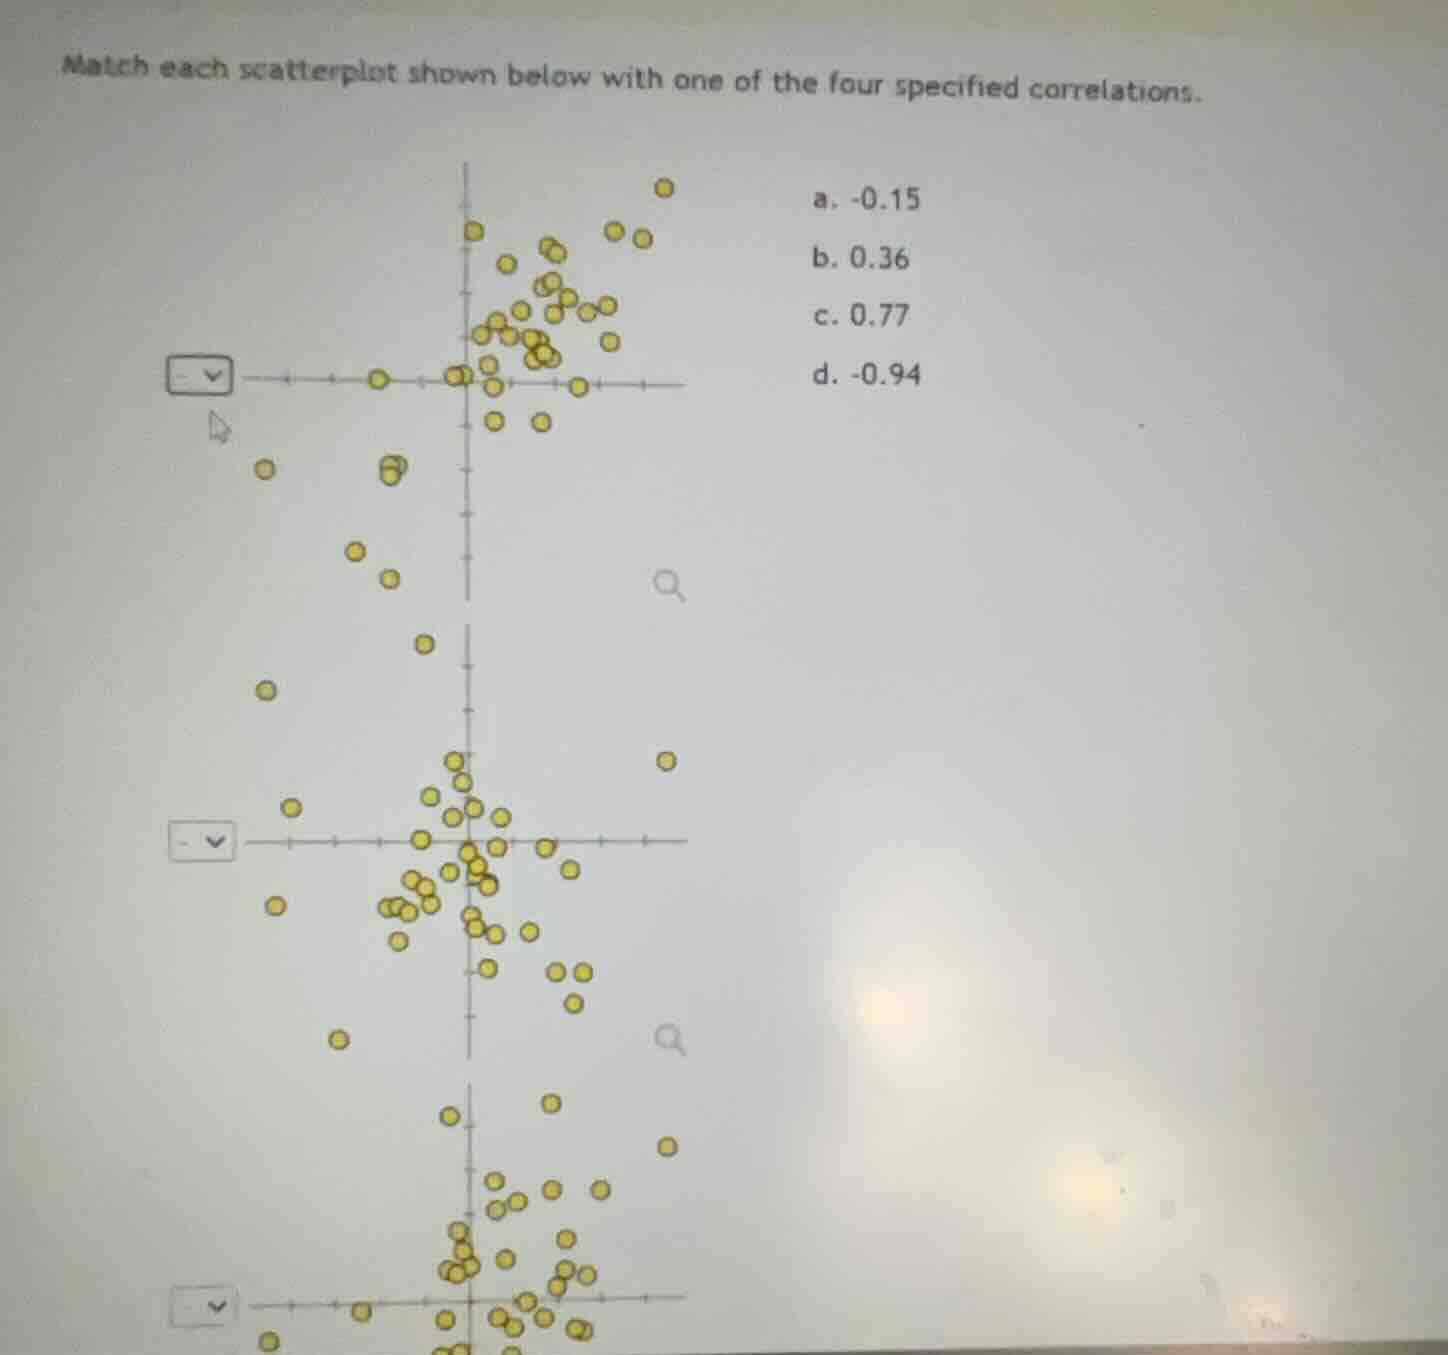
match each scatterplot shown below with one of the four specified correlations.
a. -0.15
b. 0.36
c. 0.77
d. -0.94
To solve the problem of matching each scatterplot with the appropriate correlation, we analyze the direction and strength of the linear relationship in each scatterplot:
Scatterplot 1 (Top)
- Direction: Positive (as \( x \) increases, \( y \) tends to increase).
- Strength: Moderate (the points show a somewhat loose but positive linear trend).
- Correlation: Among the options, \( 0.36 \) (option b) is a moderate positive correlation, which fits this scatterplot.
Scatterplot 2 (Middle)
- Direction: Negative (as \( x \) increases, \( y \) tends to decrease).
- Strength: Weak (the points are scattered but show a slight negative trend).
- Correlation: Among the options, \( -0.15 \) (option a) is a weak negative correlation, which fits this scatterplot.
Scatterplot 3 (Bottom)
- Direction: Positive (as \( x \) increases, \( y \) tends to increase).
- Strength: Strong (the points show a tight positive linear trend).
- Correlation: Among the options, \( 0.77 \) (option c) is a strong positive correlation, which fits this scatterplot. (Note: If there was a fourth scatterplot, \( -0.94 \) (option d) would be a strong negative correlation, but based on the three shown, we match the top to b, middle to a, and bottom to c.)
Final Matches:
- Top Scatterplot: \(\boldsymbol{\text{b. } 0.36}\)
- Middle Scatterplot: \(\boldsymbol{\text{a. } -0.15}\)
- Bottom Scatterplot: \(\boldsymbol{\text{c. } 0.77}\)
(If there’s a fourth scatterplot not fully visible, the remaining correlation \(-0.94\) (d) would match a strong negative scatterplot.)

Snap & solve any problem in the app
Get step-by-step solutions on Sovi AI
Photo-based solutions with guided steps
Explore more problems and detailed explanations
To solve the problem of matching each scatterplot with the appropriate correlation, we analyze the direction and strength of the linear relationship in each scatterplot:
Scatterplot 1 (Top)
- Direction: Positive (as \( x \) increases, \( y \) tends to increase).
- Strength: Moderate (the points show a somewhat loose but positive linear trend).
- Correlation: Among the options, \( 0.36 \) (option b) is a moderate positive correlation, which fits this scatterplot.
Scatterplot 2 (Middle)
- Direction: Negative (as \( x \) increases, \( y \) tends to decrease).
- Strength: Weak (the points are scattered but show a slight negative trend).
- Correlation: Among the options, \( -0.15 \) (option a) is a weak negative correlation, which fits this scatterplot.
Scatterplot 3 (Bottom)
- Direction: Positive (as \( x \) increases, \( y \) tends to increase).
- Strength: Strong (the points show a tight positive linear trend).
- Correlation: Among the options, \( 0.77 \) (option c) is a strong positive correlation, which fits this scatterplot. (Note: If there was a fourth scatterplot, \( -0.94 \) (option d) would be a strong negative correlation, but based on the three shown, we match the top to b, middle to a, and bottom to c.)
Final Matches:
- Top Scatterplot: \(\boldsymbol{\text{b. } 0.36}\)
- Middle Scatterplot: \(\boldsymbol{\text{a. } -0.15}\)
- Bottom Scatterplot: \(\boldsymbol{\text{c. } 0.77}\)
(If there’s a fourth scatterplot not fully visible, the remaining correlation \(-0.94\) (d) would match a strong negative scatterplot.)