QUESTION IMAGE
Question
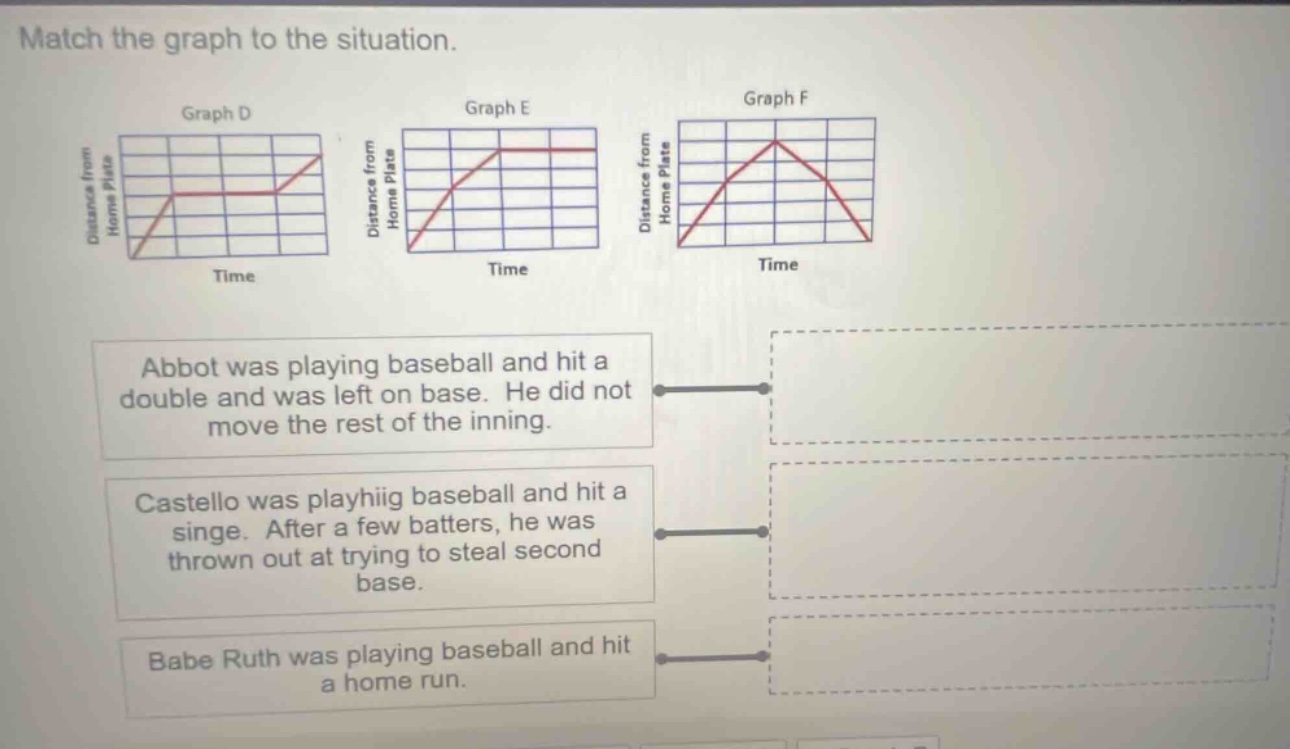
match the graph to the situation.
graph d
graph e
graph f
distance from
home plate
distance from
home plate
distance from
home plate
time
time
time
abbot was playing baseball and hit a
double and was left on base. he did not
move the rest of the inning.
castello was playhiig baseball and hit a
singe. after a few batters, he was
thrown out at trying to steal second
base.
babe ruth was playing baseball and hit
a home run.
To solve this, we analyze each situation and match it to the graph by understanding how distance from home plate changes over time:
1. Abbot’s Situation:
Abbot hit a double (moves to second base) and then “did not move the rest of the inning.” So, distance from home plate increases, then stays constant. Graph E shows distance increasing (steep then less steep, but still increasing) until it plateaus (no movement). Wait, correction: Wait, re - evaluate. Wait, Abbot hit a double (moves to second base) then stays. Wait, maybe Graph E? Wait, no—wait, let's re - check:
Wait, “left on base” after a double: he moves to a base, then stops. Wait, Graph E: distance increases, then becomes constant (flat line). So Abbot → Graph E? Wait, no, let's check each:
- Abbot: Hit double (moves), then no movement. So distance from home plate: increases to a point, then stays. So the graph with a flat line after increasing. Graph E? Wait, no, Graph D: increases, flat, then increases? No, wait the three graphs:
Graph D: distance from home plate: increases, flat, then increases.
Graph E: increases, then flat (constant).
Graph F: increases to a peak (home run, since home run means he goes around all bases and back to home, so distance from home plate increases to a peak (when he's at the farthest, like third base) then decreases back to zero). Wait, Babe Ruth hit a home run: he runs around all bases, so distance from home plate increases (as he runs to first, second, third) then decreases back to zero (when he scores at home). So Graph F: distance increases to a peak, then decreases to zero.
Castello hit a single (moves to first base), then tried to steal second (moves again) but was thrown out. So distance from home plate: increases (to first), then increases (to second, but then—wait, no, if he's thrown out, does he get back? No, wait, when you steal second and get thrown out, you were trying to go to second but got out, so maybe distance increases, then maybe? Wait, no, let's re - align:
- Babe Ruth (home run): Runs around bases, so distance from home plate: starts at 0, increases to a maximum (when he's at third base, farthest from home), then decreases back to 0 (when he scores at home). So Graph F (increases to peak, then decreases to 0).
- Abbot (double, left on base): Hits double (moves to second base), then stays. So distance from home plate: increases to a point (second base), then stays constant. So Graph E (increases, then flat line).
- Castello (single, then steal second but thrown out): Hits single (moves to first base, distance increases), then tries to steal second (distance increases more), but gets thrown out—wait, no, if he's thrown out, does he go back? Wait, no, when you steal second and get thrown out, you were running to second, so maybe distance increases, then maybe? Wait, no, the graph D: increases, flat, then increases. Wait, maybe Castello: hits single (distance up), then waits (flat), then tries to steal (distance up again) but—no, the problem says “was thrown out at trying to steal second base”—maybe he was on first, then tried to go to second, so distance from home plate: increases to first, stays (flat), then increases to second (but then got out, but maybe the graph shows increasing, flat, then increasing? No, that doesn't fit. Wait, maybe I mixed up. Let's start over:
- Home Run (Babe Ruth): He hits the ball, runs around all bases (first, second, third, home). So distance from home plate: starts at 0, increases to a maximum (when he's at third base, farthest from home), then decreases b…

Snap & solve any problem in the app
Get step-by-step solutions on Sovi AI
Photo-based solutions with guided steps
Explore more problems and detailed explanations
To solve this, we analyze each situation and match it to the graph by understanding how distance from home plate changes over time:
1. Abbot’s Situation:
Abbot hit a double (moves to second base) and then “did not move the rest of the inning.” So, distance from home plate increases, then stays constant. Graph E shows distance increasing (steep then less steep, but still increasing) until it plateaus (no movement). Wait, correction: Wait, re - evaluate. Wait, Abbot hit a double (moves to second base) then stays. Wait, maybe Graph E? Wait, no—wait, let's re - check:
Wait, “left on base” after a double: he moves to a base, then stops. Wait, Graph E: distance increases, then becomes constant (flat line). So Abbot → Graph E? Wait, no, let's check each:
- Abbot: Hit double (moves), then no movement. So distance from home plate: increases to a point, then stays. So the graph with a flat line after increasing. Graph E? Wait, no, Graph D: increases, flat, then increases? No, wait the three graphs:
Graph D: distance from home plate: increases, flat, then increases.
Graph E: increases, then flat (constant).
Graph F: increases to a peak (home run, since home run means he goes around all bases and back to home, so distance from home plate increases to a peak (when he's at the farthest, like third base) then decreases back to zero). Wait, Babe Ruth hit a home run: he runs around all bases, so distance from home plate increases (as he runs to first, second, third) then decreases back to zero (when he scores at home). So Graph F: distance increases to a peak, then decreases to zero.
Castello hit a single (moves to first base), then tried to steal second (moves again) but was thrown out. So distance from home plate: increases (to first), then increases (to second, but then—wait, no, if he's thrown out, does he get back? No, wait, when you steal second and get thrown out, you were trying to go to second but got out, so maybe distance increases, then maybe? Wait, no, let's re - align:
- Babe Ruth (home run): Runs around bases, so distance from home plate: starts at 0, increases to a maximum (when he's at third base, farthest from home), then decreases back to 0 (when he scores at home). So Graph F (increases to peak, then decreases to 0).
- Abbot (double, left on base): Hits double (moves to second base), then stays. So distance from home plate: increases to a point (second base), then stays constant. So Graph E (increases, then flat line).
- Castello (single, then steal second but thrown out): Hits single (moves to first base, distance increases), then tries to steal second (distance increases more), but gets thrown out—wait, no, if he's thrown out, does he go back? Wait, no, when you steal second and get thrown out, you were running to second, so maybe distance increases, then maybe? Wait, no, the graph D: increases, flat, then increases. Wait, maybe Castello: hits single (distance up), then waits (flat), then tries to steal (distance up again) but—no, the problem says “was thrown out at trying to steal second base”—maybe he was on first, then tried to go to second, so distance from home plate: increases to first, stays (flat), then increases to second (but then got out, but maybe the graph shows increasing, flat, then increasing? No, that doesn't fit. Wait, maybe I mixed up. Let's start over:
- Home Run (Babe Ruth): He hits the ball, runs around all bases (first, second, third, home). So distance from home plate: starts at 0, increases to a maximum (when he's at third base, farthest from home), then decreases back to 0 (when he scores at home). So this matches Graph F (distance increases to a peak, then decreases to 0).
- Double, left on base (Abbot): Hits a double (runs to second base), then stays on base (no movement). So distance from home plate: increases to the distance of second base, then stays constant. So the graph with a flat line after increasing. Graph E (distance increases, then becomes constant).
- Single, then steal second (Castello): Hits a single (runs to first base, distance increases), then waits (flat line, “after a few batters” he tries to steal second—so distance increases again (to second base) but then—wait, no, if he's thrown out, does the graph show that? Wait, the graph D: distance increases, flat, then increases. So maybe Castello: hits single (distance up), waits (flat), then tries to steal (distance up again). So Castello → Graph D.
Final Matches:
- Abbot (double, left on base) → Graph E
- Castello (single, steal second, thrown out) → Graph D
- Babe Ruth (home run) → Graph F
So:
- Abbot was playing baseball... → Graph E
- Castello was playing baseball... → Graph D
- Babe Ruth was playing baseball... → Graph F