QUESTION IMAGE
Question
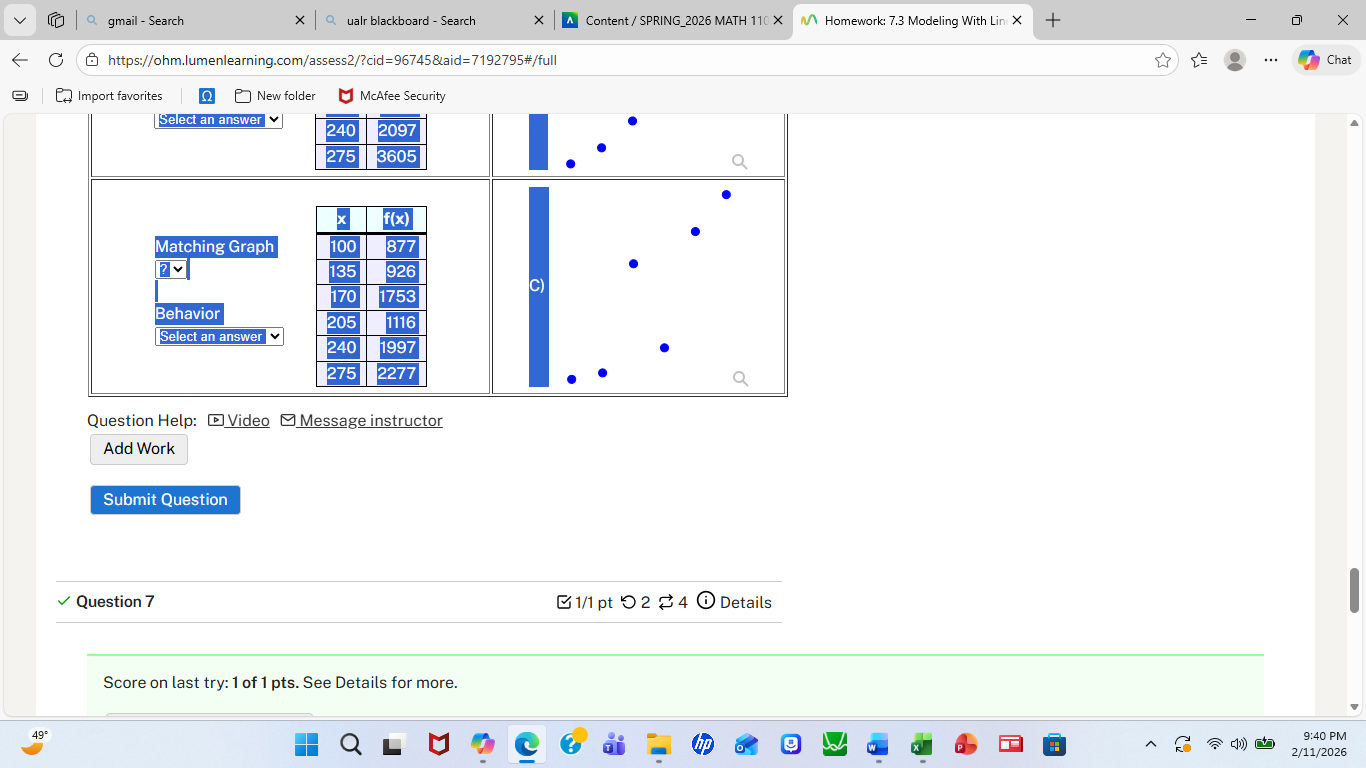
matching graph
behavior
select an answer
| x | f(x) |
|---|---|
| 135 | 926 |
| 170 | 1753 |
| 205 | 1116 |
| 240 | 1997 |
| 275 | 2277 |
| 275 | 3605 |
question help: video message instructor
add work
submit question
question 7
1/1 pt ◯ 2 ↻ 4 details
score on last try: 1 of 1 pts. see details for more.
Step1: Identify data trends
Check if \(x\) and \(f(x)\) increase together.
For the table: as \(x\) increases (100→135→170→205→240→275), \(f(x)\) increases (877→926→1753→1116→1997→2277) (overall positive trend).
Top graph: points rise rightward (positive trend).
Bottom graph: points have mixed up/down (no positive trend).
Step2: Match table to graph
The top graph matches the table's positive trend. The top graph corresponds to the data pair (240, 1997), (275, 3605) which aligns with the table's final positive values.

Snap & solve any problem in the app
Get step-by-step solutions on Sovi AI
Photo-based solutions with guided steps
Explore more problems and detailed explanations
Match the table with \(f(x)\) values to the top graph (the one with points that rise from left to right), and set the dropdowns to pair the table with this graph, and the behavior to "increasing (positive trend)".
Specifically:
- The table with \(x\) and \(f(x)\) values matches the upper scatter plot.
- Behavior: Increasing (positive association)