QUESTION IMAGE
Question
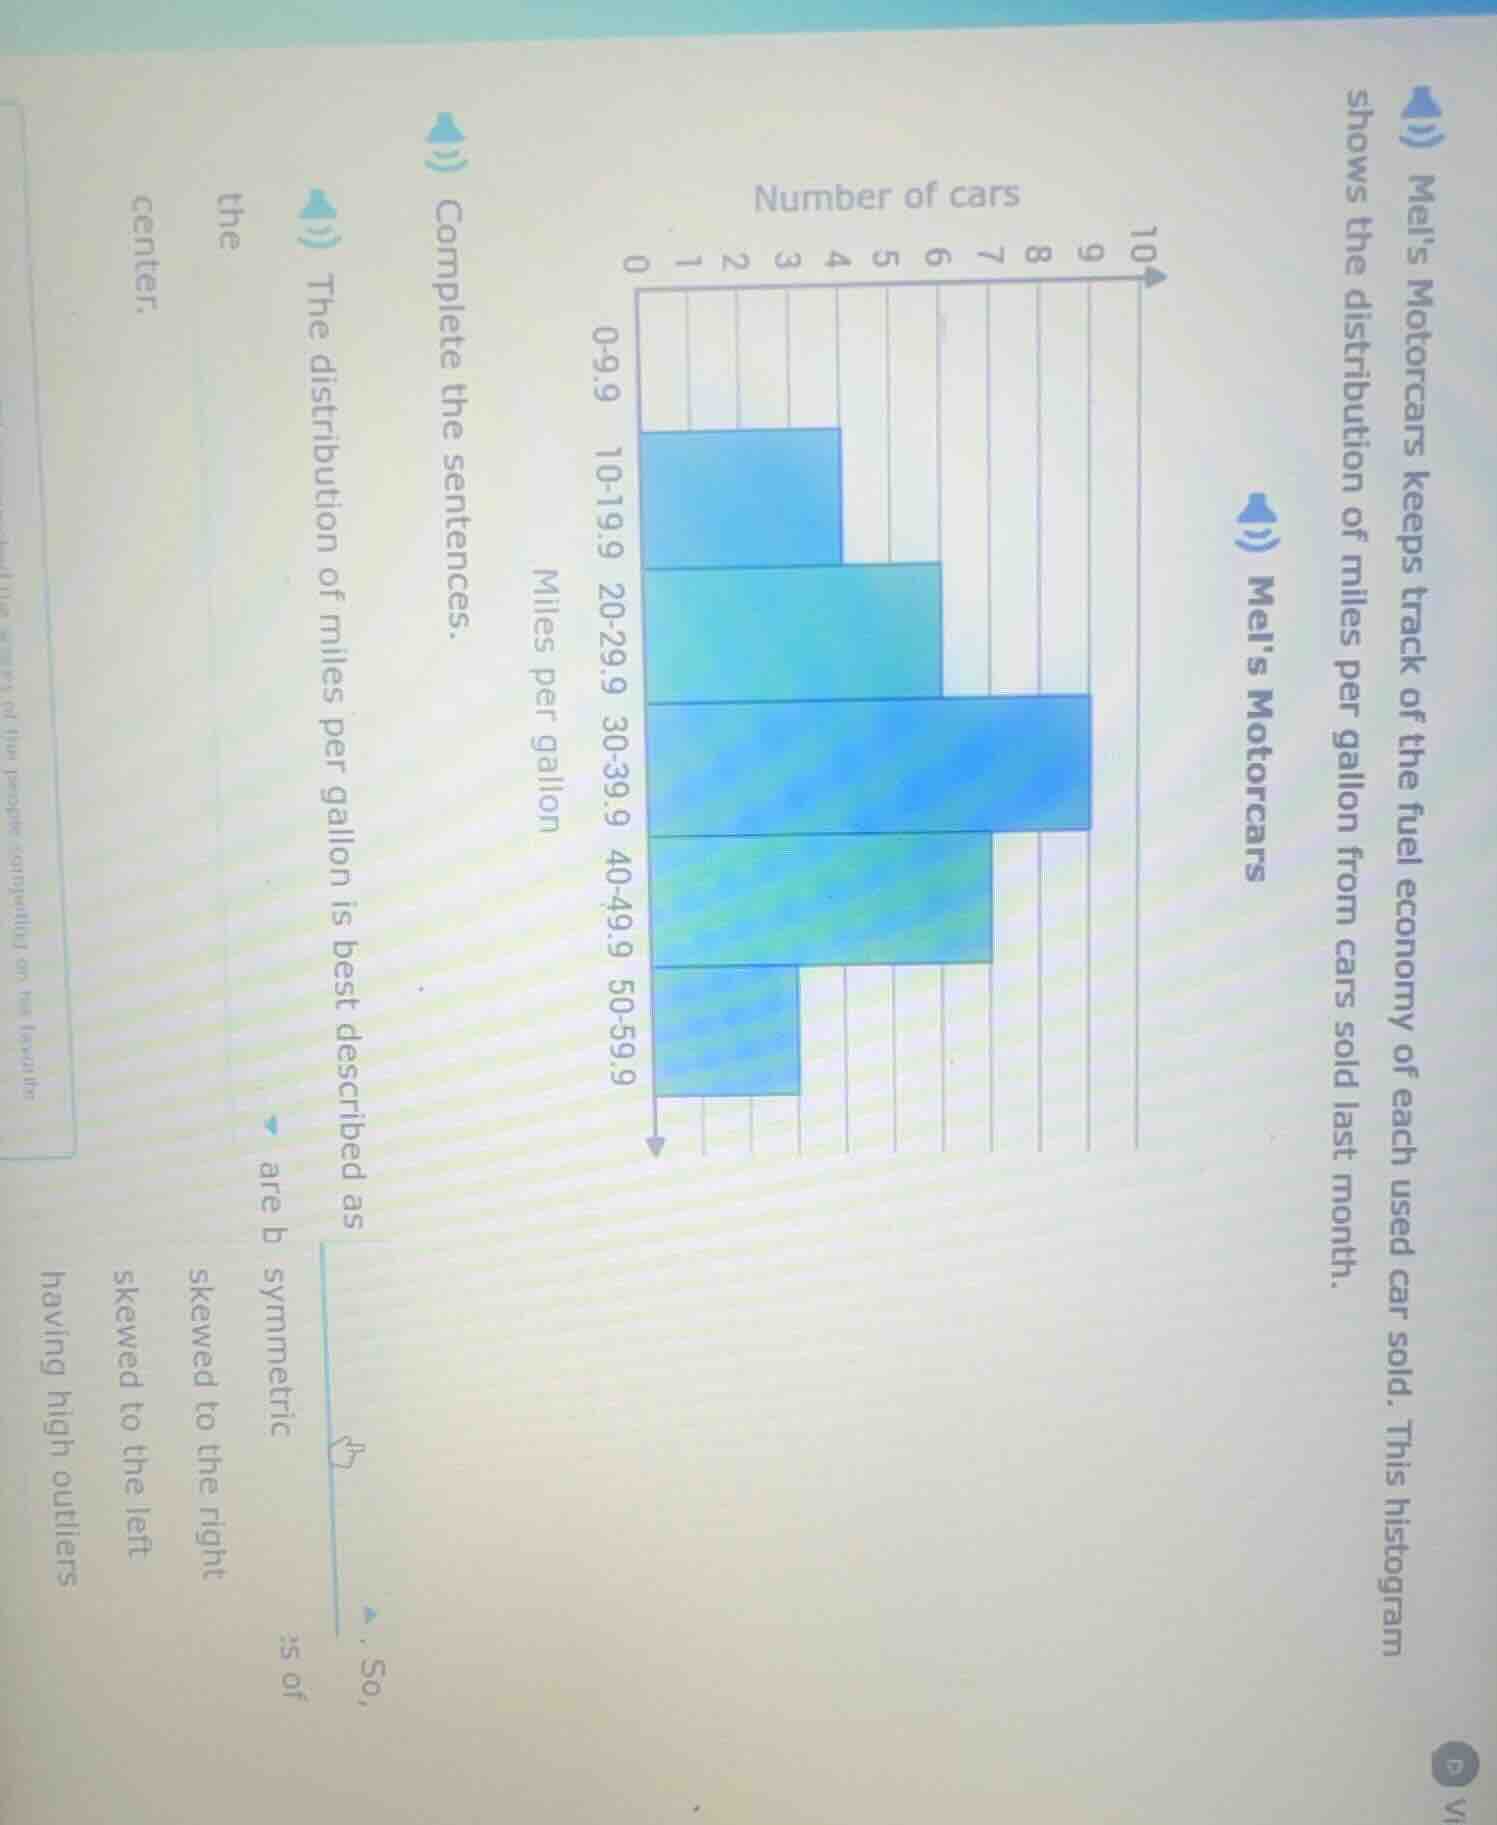
mels motorcars keeps track of the fuel economy of each used car sold. this histogram shows the distribution of miles per gallon from cars sold last month.
mels motorcars
complete the sentences.
the distribution of miles per gallon is best described as
are b symmetric
skewed to the right
skewed to the left
having high outliers
the
center.
miles per gallon
number of cars
To determine the distribution shape, we analyze the histogram. A symmetric distribution has roughly equal frequencies on both sides of the center (the tallest bar or middle range). Here, the frequencies for the ranges around 30 - 39.9 (the middle - looking range) have similar frequencies on the lower (10 - 19.9, 0 - 9.9) and upper (40 - 49.9, 50 - 59.9) sides. There's no long tail on one side (which would indicate skewness) and no extreme values (outliers) that stand out. So the distribution is symmetric.

Snap & solve any problem in the app
Get step-by-step solutions on Sovi AI
Photo-based solutions with guided steps
Explore more problems and detailed explanations
The distribution of miles per gallon is best described as symmetric. So, the first blank is filled with "symmetric".