QUESTION IMAGE
Question
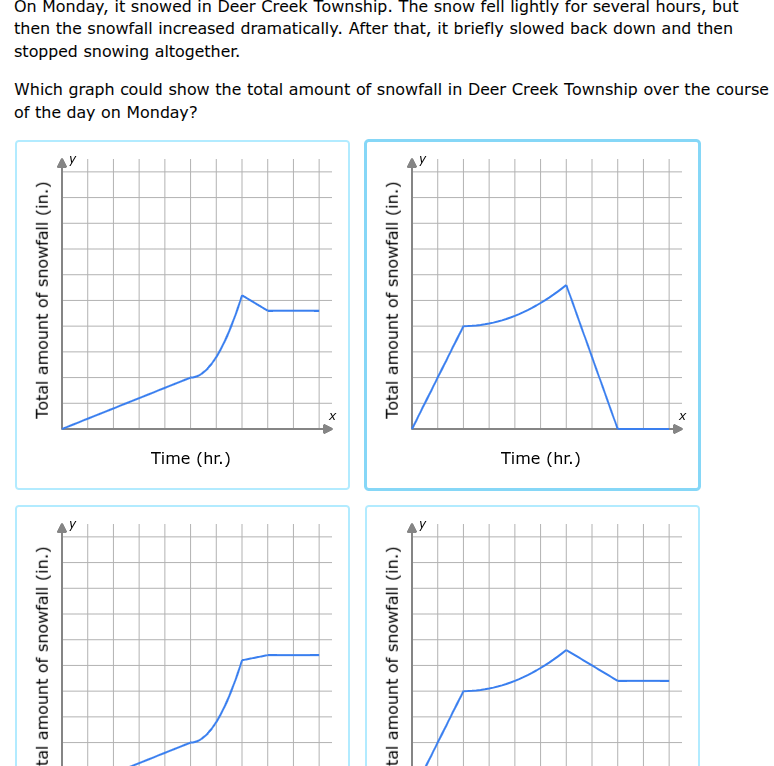
on monday, it snowed in deer creek township. the snow fell lightly for several hours, but then the snowfall increased dramatically. after that, it briefly slowed back down and then stopped snowing altogether. which graph could show the total amount of snowfall in deer creek township over the course of the day on monday?
Step1: Analyze snowfall rate changes
The snow starts with light fall (slow increase in total snow), then increases dramatically (steeper increase), then briefly slows (slight increase or flat), then stops (flat line, total snow doesn't decrease as snow stops, not melts here).
Step2: Evaluate each graph
- Top - left: Starts with slow increase, then steeper (dramatic snowfall), then brief slow (small rise or flat), then flat (snow stops). Matches the description.
- Top - right: Snow decreases at the end, but snow stopped, not melted (so total snow shouldn't decrease). Eliminate.
- Bottom - left: After dramatic snowfall, it becomes flat immediately, no "briefly slowed" phase. Eliminate.
- Bottom - right: Snow decreases at the end, which is incorrect as snow stopped, not melted. Eliminate.

Snap & solve any problem in the app
Get step-by-step solutions on Sovi AI
Photo-based solutions with guided steps
Explore more problems and detailed explanations
The top - left graph (with axes Time (hr.) on x and Total amount of snowfall (in.) on y, showing slow increase, then steeper, then brief slow, then flat)