QUESTION IMAGE
Question
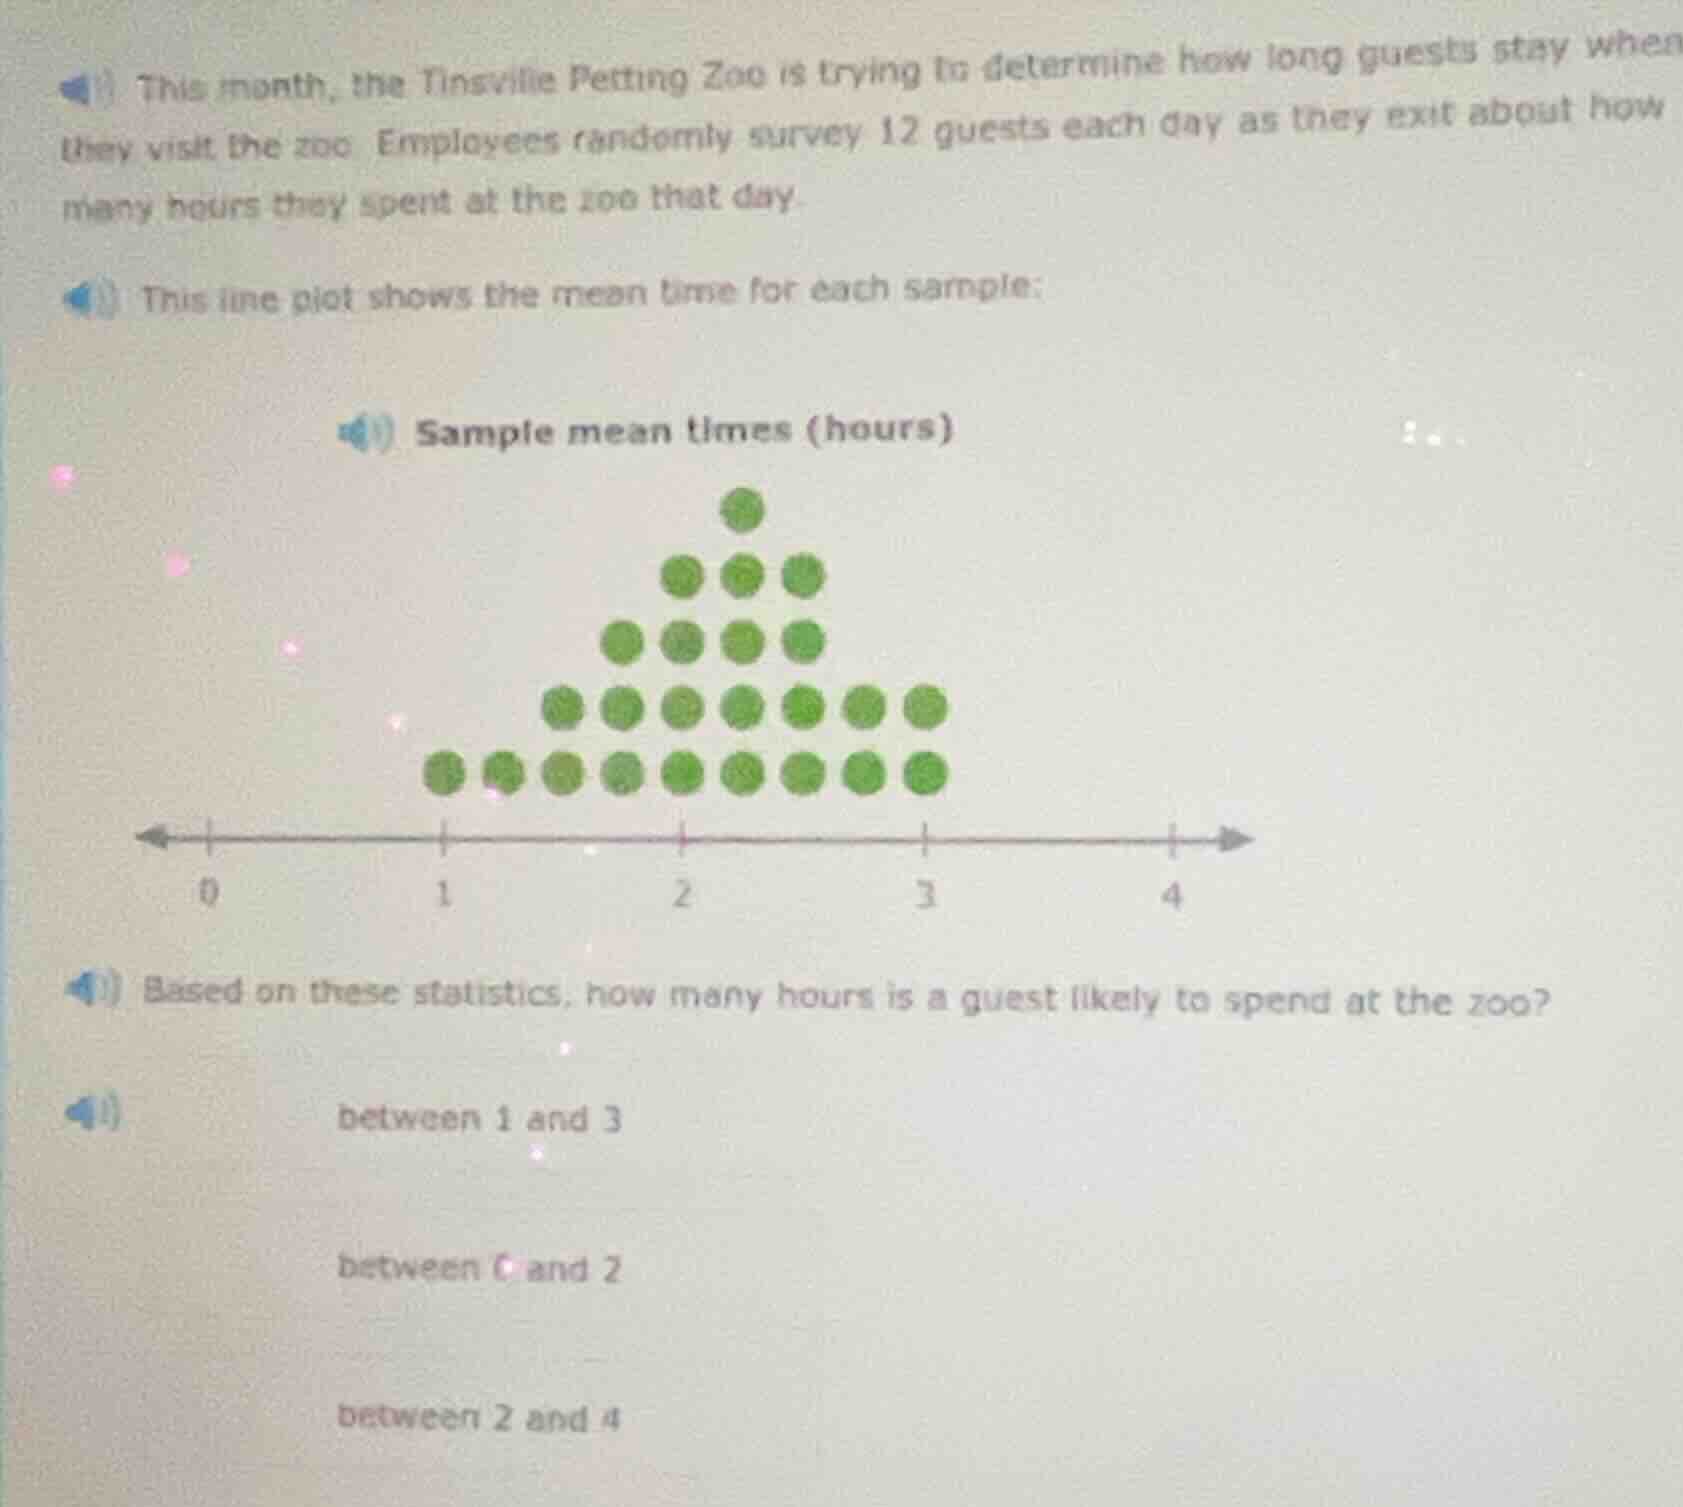
this month, the tinsville petting zoo is trying to determine how long guests stay when they visit the zoo. employees randomly survey 12 guests each day as they exit about how many hours they spent at the zoo that day. this line plot shows the mean time for each sample: sample mean times (hours) (line plot with green dots on a number line from 0 to 4, with more dots around 1 - 3) based on these statistics, how many hours is a guest likely to spend at the zoo? between 1 and 3 between 0 and 2 between 2 and 4
To determine how many hours a guest is likely to spend at the zoo, we analyze the line plot of sample mean times. The majority of the data points (the green dots representing sample means) fall between 1 and 3 on the horizontal axis (which measures hours spent at the zoo). The other ranges (between 0 and 2, or between 2 and 4) do not capture the central cluster of the data as well as the range between 1 and 3.

Snap & solve any problem in the app
Get step-by-step solutions on Sovi AI
Photo-based solutions with guided steps
Explore more problems and detailed explanations
between 1 and 3