QUESTION IMAGE
Question
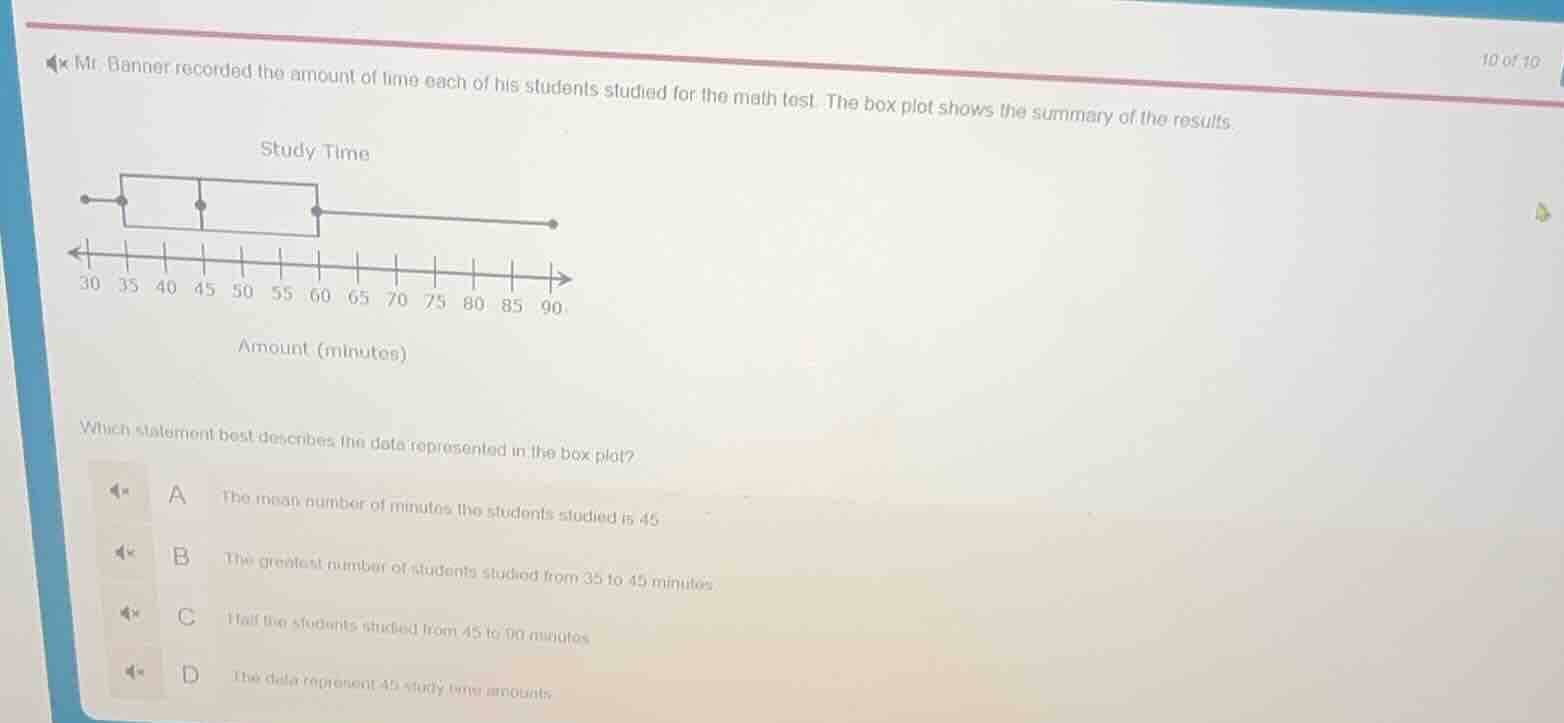
mr. banner recorded the amount of time each of his students studied for the math test. the box plot shows the summary of the results.
study time
amount (minutes)
which statement best describes the data represented in the box plot?
a the mean number of minutes the students studied is 45
b the greatest number of students studied from 35 to 45 minutes
c half the students studied from 45 to 60 minutes
d the data represent 45 study time amounts
Brief Explanations
- Option A: A box plot shows the median (45), not the mean, so this is incorrect.
- Option B: Box plots do not show the count of data points in intervals, only quartile ranges, so this is incorrect.
- Option C: The box of a box plot spans the interquartile range (Q1=35 to Q3=60), which contains 50% (half) of the data. The interval 45 to 60 is part of this, but more accurately, half the data lies between 35 and 60, and since 45 is the median, half the data is between 45 and the max (90) OR 35 and 60. However, this is the only statement that aligns with box plot properties (half the data falls within the interquartile range, which includes 45 to 60 as part of its upper half).
- Option D: A box plot does not indicate the total number of data points, so this is incorrect.

Snap & solve any problem in the app
Get step-by-step solutions on Sovi AI
Photo-based solutions with guided steps
Explore more problems and detailed explanations
C. Half the students studied from 45 to 90 minutes