QUESTION IMAGE
Question
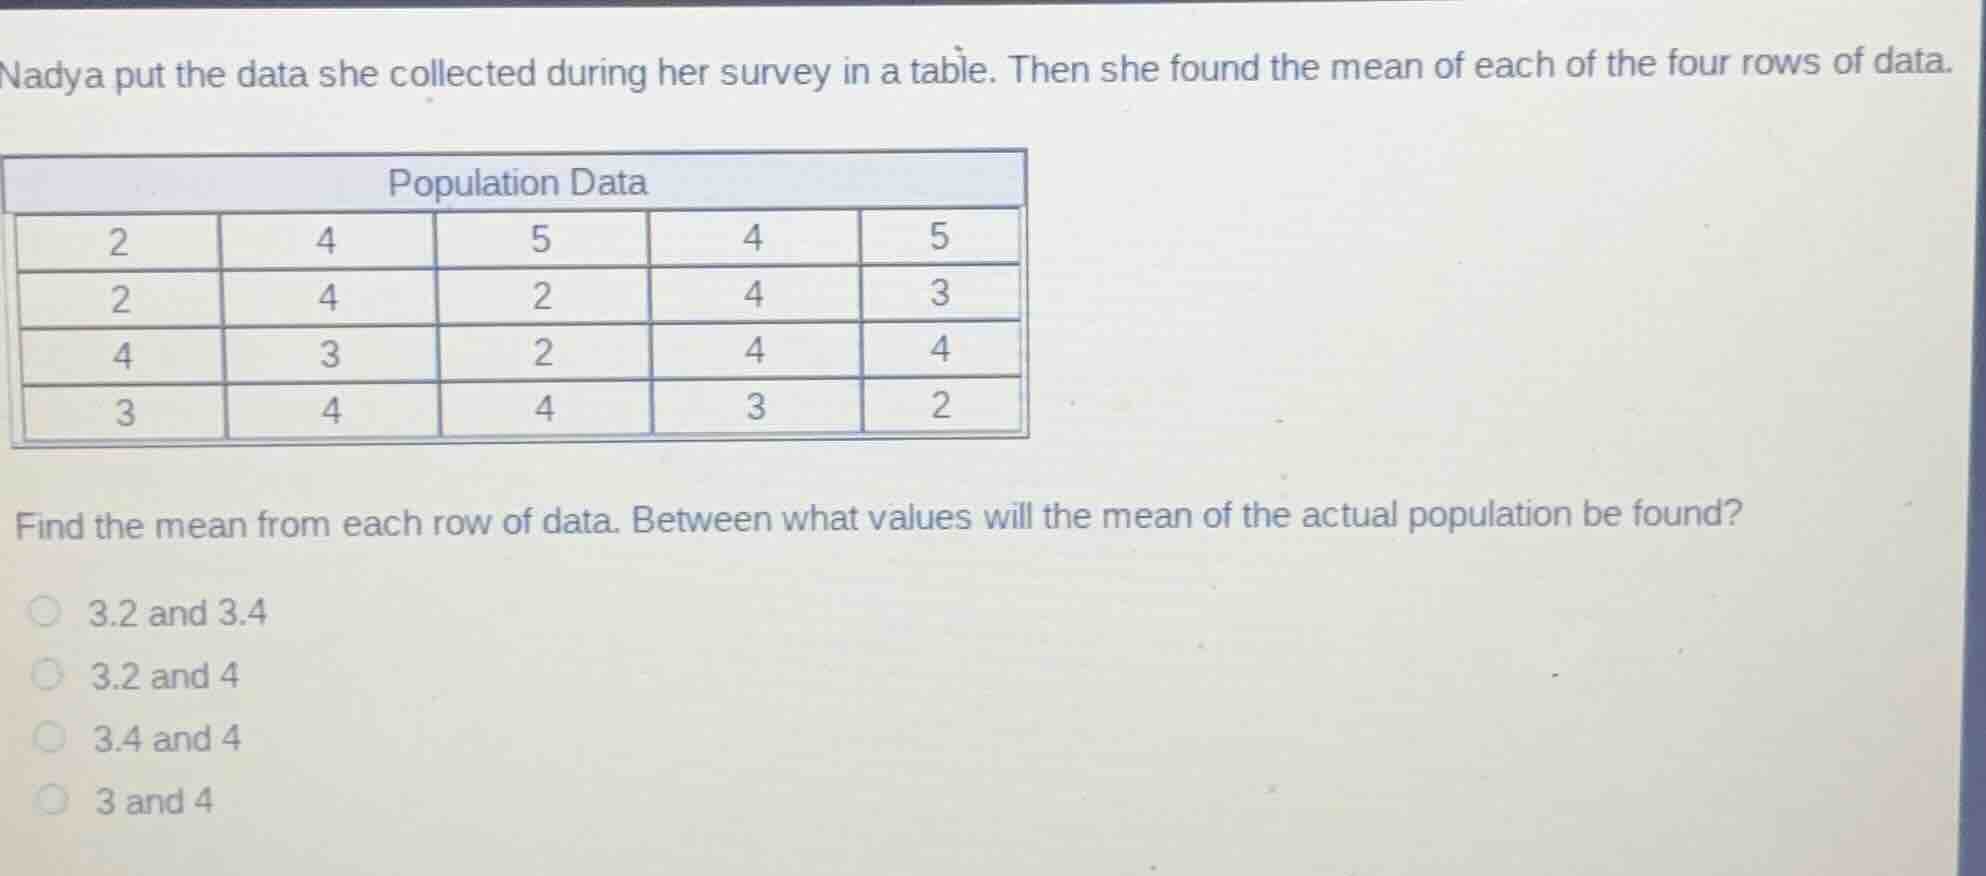
nadya put the data she collected during her survey in a table. then she found the mean of each of the four rows of data.
population data
2 4 5 4 5
2 4 2 4 3
4 3 2 4 4
3 4 4 3 2
find the mean from each row of data. between what values will the mean of the actual population be found?
3.2 and 3.4
3.2 and 4
3.4 and 4
3 and 4
Step1: Calculate Row 1 mean
Sum values, divide by 5.
$\text{Mean}_1 = \frac{2+4+5+4+5}{5} = \frac{20}{5} = 4$
Step2: Calculate Row 2 mean
Sum values, divide by 5.
$\text{Mean}_2 = \frac{2+4+2+4+3}{5} = \frac{15}{5} = 3$
Step3: Calculate Row 3 mean
Sum values, divide by 5.
$\text{Mean}_3 = \frac{4+3+2+4+4}{5} = \frac{17}{5} = 3.4$
Step4: Calculate Row 4 mean
Sum values, divide by 5.
$\text{Mean}_4 = \frac{3+4+4+3+2}{5} = \frac{16}{5} = 3.2$
Step5: Identify min/max row means
The smallest row mean is 3, largest is 4.

Snap & solve any problem in the app
Get step-by-step solutions on Sovi AI
Photo-based solutions with guided steps
Explore more problems and detailed explanations
3 and 4