QUESTION IMAGE
Question
name period due date thursday, jan 29, 2020
every problem must have work or an explanation for credit.
8th grade math homework week 20: every problem must have work or an explanation for credit
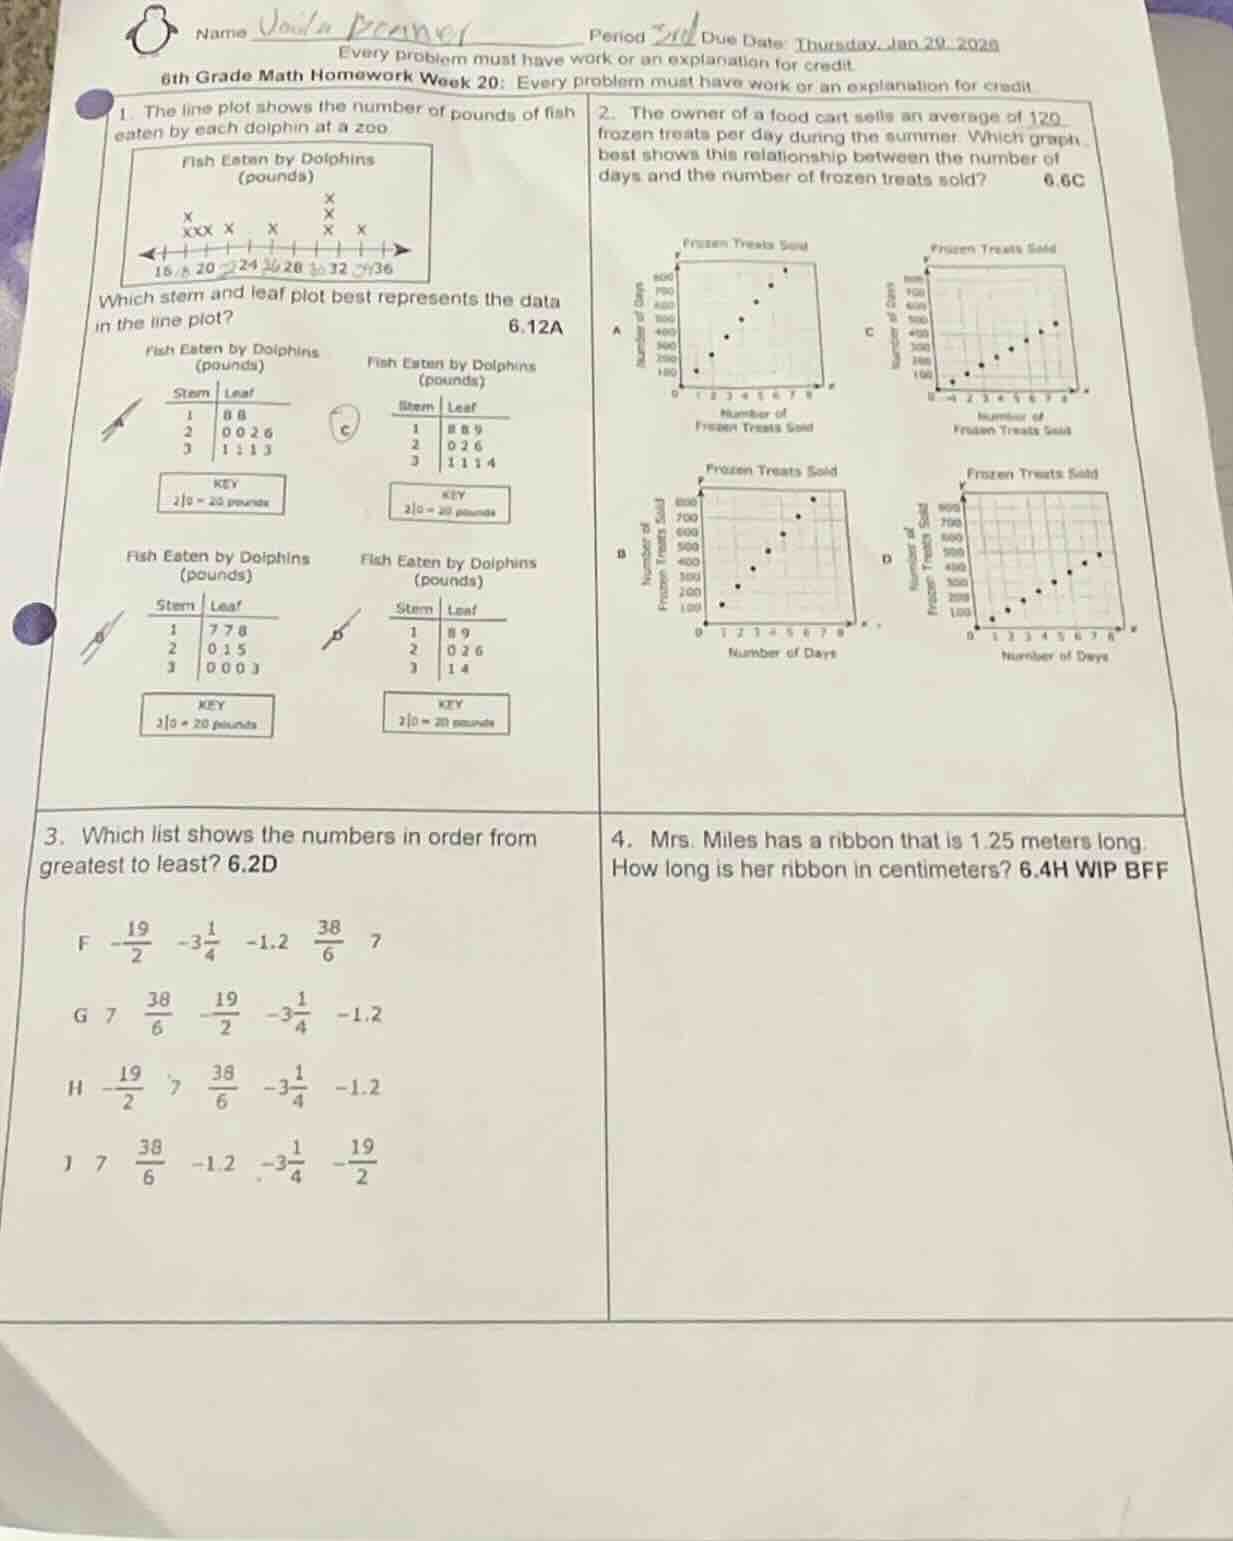
- the line plot shows the number of pounds of fish eaten by each dolphin at a zoo
fish eaten by dolphins
(pounds)
which stem and leaf plot best represents the data in the line plot? 6.12a
fish eaten by dolphins
(pounds)
fish eaten by dolphins
(pounds)
fish eaten by dolphins
(pounds)
fish eaten by dolphins
(pounds)
- the owner of a food cart sells an average of 120 frozen treats per day during the summer. which graph best shows this relationship between the number of days and the number of frozen treats sold? 6.6c
- which list shows the numbers in order from greatest to least? 6.2d
f $-\frac{19}{2}$ $-3\frac{1}{4}$ $-1.2$ $\frac{38}{6}$ 7
g 7 $\frac{38}{6}$ $-\frac{19}{2}$ $-3\frac{1}{4}$ $-1.2$
h $\frac{19}{2}$ 7 $\frac{38}{6}$ $-3\frac{1}{4}$ $-1.2$
i 7 $\frac{38}{6}$ $-1.2$ $-3\frac{1}{4}$ $-\frac{19}{2}$
- mrs. miles has a ribbon that is 1.25 meters long. how long is her ribbon in centimeters? 6.4h wip bff
Problem 1: Stem - and - Leaf Plot for Dolphin Fish Data
- First, we need to determine the data points from the line plot. The line plot has marks (x's) at different values. Let's list out the values:
- For stem 1 (representing 10 - 19 pounds? Wait, looking at the key: \(2|0 = 20\) pounds, so stem 1 is 10 - 19, stem 2 is 20 - 29, stem 3 is 30 - 39.
- From the line plot:
- Values in the 10 - 19 range: Let's see the x's. Wait, the horizontal axis is 15, 20, 24, 26, 28, 32, 36? Wait, no, the line plot is labeled with 15, 20, 24, 26, 28, 32, 36? Wait, the stem - and - leaf plot key is \(2|0=20\) pounds, so stem 1: 10 - 19, stem 2: 20 - 29, stem 3: 30 - 39.
- Looking at the line plot:
- For stem 1 (10 - 19): Let's count the x's. Wait, maybe I misread. Wait, the line plot has x's at: Let's see the first x is at 18? Wait, no, the key for the stem - and - leaf plot is \(2|0 = 20\) pounds, so stem 1: 10 - 19, stem 2: 20 - 29, stem 3: 30 - 39.
- From the line plot, the values:
- Stem 1 (10 - 19): Let's say the x's in the 10 - 19 range: If the first x is at 18 and 19? Wait, looking at the options, the first stem - and - leaf plot option C has stem 1: 8, 9 (so 18, 19), stem 2: 0, 2, 6 (20, 22, 26), stem 3: 1, 1, 1, 4 (31, 31, 31, 34)? Wait, no, let's re - evaluate.
- Wait, the correct way: The line plot shows the number of pounds of fish eaten. Let's list the data points:
- From the line plot, the x's are at: Let's assume the values are: 18, 19 (stem 1), 20, 22, 26 (stem 2), 31, 31, 31, 34 (stem 3)? Wait, no, looking at the options, option C has stem 1: 8, 9 (so 18, 19), stem 2: 0, 2, 6 (20, 22, 26), stem 3: 1, 1, 1, 4 (31, 31, 31, 34)? Wait, maybe the correct stem - and - leaf plot is the one with stem 1: 8, 9 (18, 19), stem 2: 0, 2, 6 (20, 22, 26), stem 3: 1, 1, 1, 4 (31, 31, 31, 34). So the correct stem - and - leaf plot is option C.
- The owner sells 120 frozen treats per day. So the number of frozen treats sold \(y\) and the number of days \(x\) have a linear relationship \(y = 120x\).
- Let's check the graphs. For a linear relationship \(y=mx + b\) (here \(b = 0\) and \(m = 120\)).
- Let's check the slope. For \(x = 1\), \(y=120\); \(x = 2\), \(y = 240\); \(x=3\), \(y = 360\); etc.
- Looking at the graphs:
- Graph D: Let's check the points. If \(x = 1\), \(y = 120\); \(x = 2\), \(y = 240\); \(x=3\), \(y = 360\); \(x = 4\), \(y = 480\); \(x = 5\), \(y = 600\); \(x = 6\), \(y = 720\); \(x = 7\), \(y = 840\); \(x = 8\), \(y = 960\). Wait, no, the graph should have a slope of 120. Let's check the axes. The vertical axis is the number of frozen treats sold, and the horizontal axis is the number of days.
- If the owner sells 120 per day, then the equation is \(y = 120x\). So when \(x = 1\), \(y = 120\); \(x = 2\), \(y = 240\); \(x=3\), \(y = 360\); etc.
- Looking at the options, graph D (the last one) has points that follow \(y = 120x\). Wait, maybe I made a mistake. Wait, the correct graph should have a linear relationship with a slope of 120. So the answer is D? Wait, no, let's re - check. Wait, the problem says "the owner of a food cart sells an average of 120 frozen treats per day". So the number of frozen treats sold \(y=120x\), where \(x\) is the number of days. So when \(x = 1\), \(y = 120\); \(x = 2\), \(y = 240\); \(x = 3\), \(y = 360\); etc. So the graph with a slope of 120. So the correct graph is D? Wait, maybe the answer is D. But let's move to problem 3.
Problem 3: Ordering Numbers from Greatest to Least
- First, we need to convert all numbers to decimal form:
- \(7\) is \(7\).
- \(\frac{38}{6}\approx6.33\).
- \(-\frac{19}{2}=-9.5\).
- \(-3\frac{1}{4}=-3.25\).
- \(-1.2\) is \(-1.2\).
- Now, we order the numbers from greatest to least:
- Positive numbers are greater than negative numbers. Among positive numbers: \(7>\frac{38}{6}\) (since \(7 = \frac{42}{6}\) and \(\frac{42}{6}>\frac{38}{6}\)).
- Among negative numbers, the larger the absolute value, the smaller the number. So \(-1.2>-3\frac{1}{4}>-\frac{19}{2}\) (because \(|-1.2| = 1.2\), \(|-3\frac{1}{4}|=3.25\), \(|-\frac{19}{2}| = 9.5\), and \(1.2<3.25<9.5\), so \(-1.2>-3\frac{1}{4}>-\frac{19}{2}\)).
- So the order from greatest to least is \(7,\frac{38}{6},-1.2,-3\frac{1}{4},-\frac{19}{2}\), which corresponds to option J.
Problem 4: Converting Meters to Centimeters

Snap & solve any problem in the app
Get step-by-step solutions on Sovi AI
Photo-based solutions with guided steps
Explore more problems and detailed explanations
C