QUESTION IMAGE
Question
name
unit 9, day 9 hw
1.
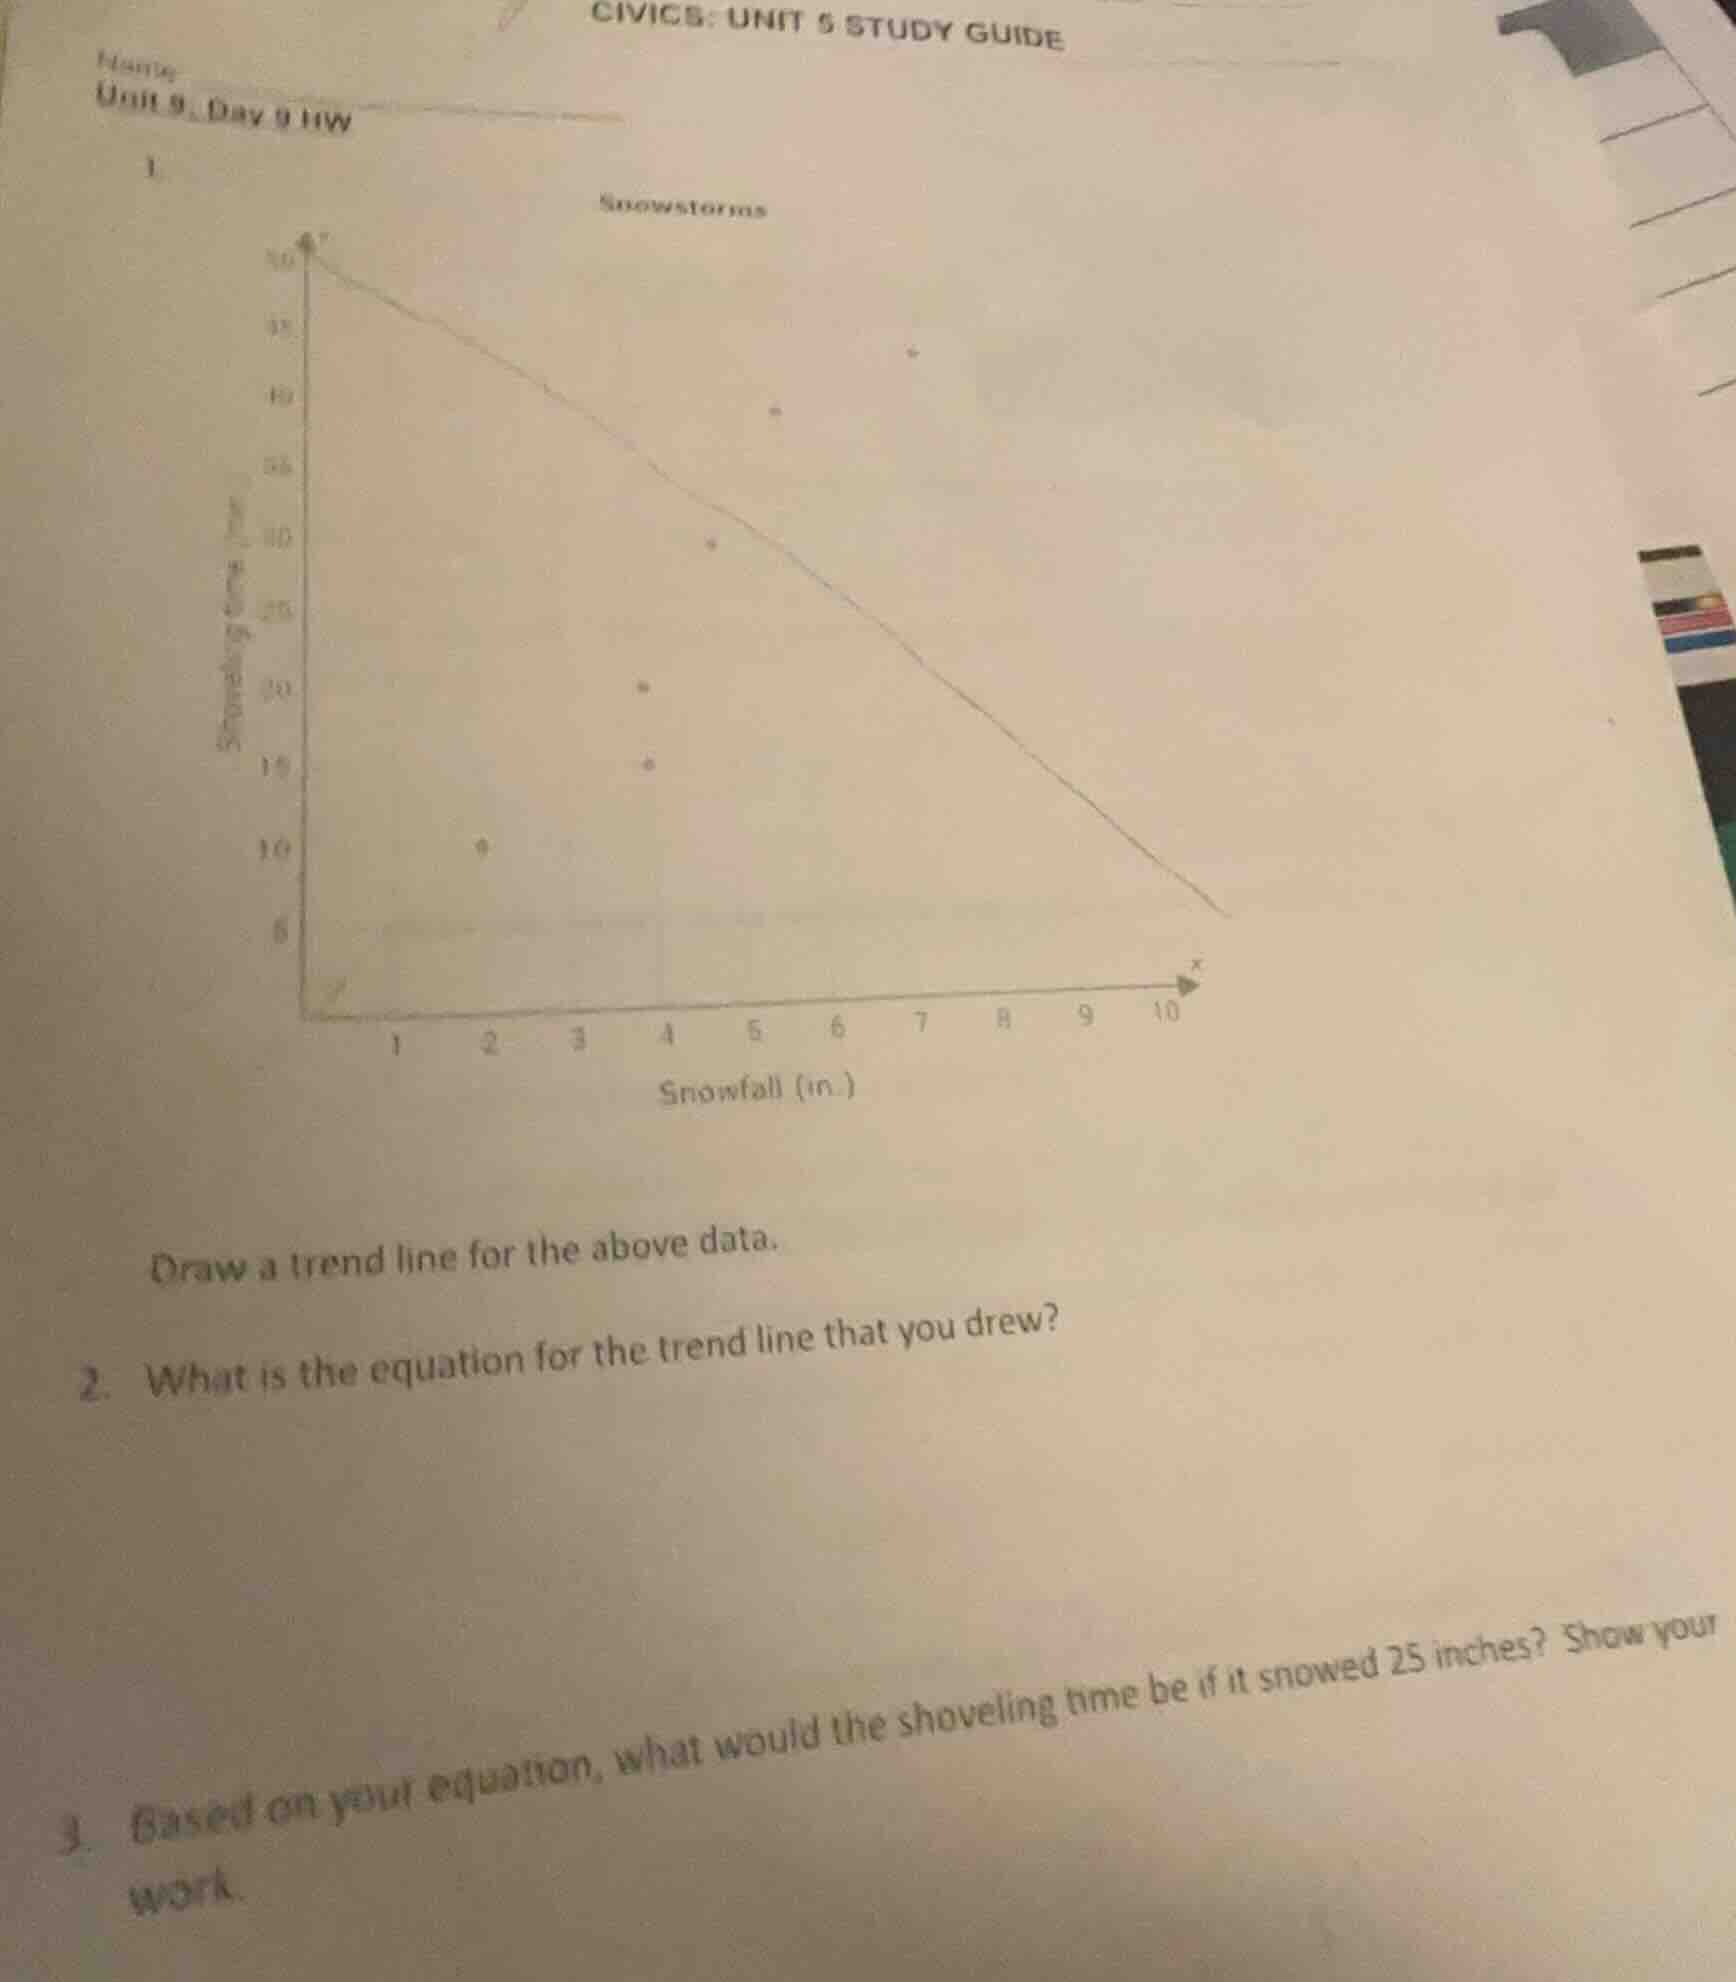
draw a trend line for the above data.
- what is the equation for the trend line that you drew?
- based on your equation, what would the shoveling time be if it snowed 25 inches? show your work.
Step1: Identify trend line points
Choose two points on the given trend line: $(0, 50)$ (y-intercept) and $(10, 5)$.
Step2: Calculate slope
Slope $m = \frac{y_2 - y_1}{x_2 - x_1} = \frac{5 - 50}{10 - 0} = \frac{-45}{10} = -4.5$
Step3: Write trend line equation
Use slope-intercept form $y = mx + b$, where $b=50$.
$y = -4.5x + 50$
Step4: Predict for 25 inches
Substitute $x=25$ into the equation.
$y = -4.5(25) + 50 = -112.5 + 50$

Snap & solve any problem in the app
Get step-by-step solutions on Sovi AI
Photo-based solutions with guided steps
Explore more problems and detailed explanations
- (The trend line is already drawn on the graph, following the negative linear pattern of the data points.)
- $y = -4.5x + 50$
- $-62.5$ (Note: A negative value here indicates the trend line is not valid for 25 inches, as shoveling time cannot be negative; the trend only applies to the range of the original data, 0-10 inches of snow.)