QUESTION IMAGE
Question
- for a new years party 794 red balloons, 741 green balloons and 368 white balloons were used. what is the total number of balloons used?
- a football stadium had 1,577 people in the stands. if 170 people left in the first quarter and another 784 left in the second quarter, how many people were left in the stadium?
- an elephant drank two liters of water a day. if there were nine elephants, how many liters of water would they drink in one day?
- katie received fifteen dollars for her birthday. later she found some toys that cost three dollars each. how many of the toys could she buy?
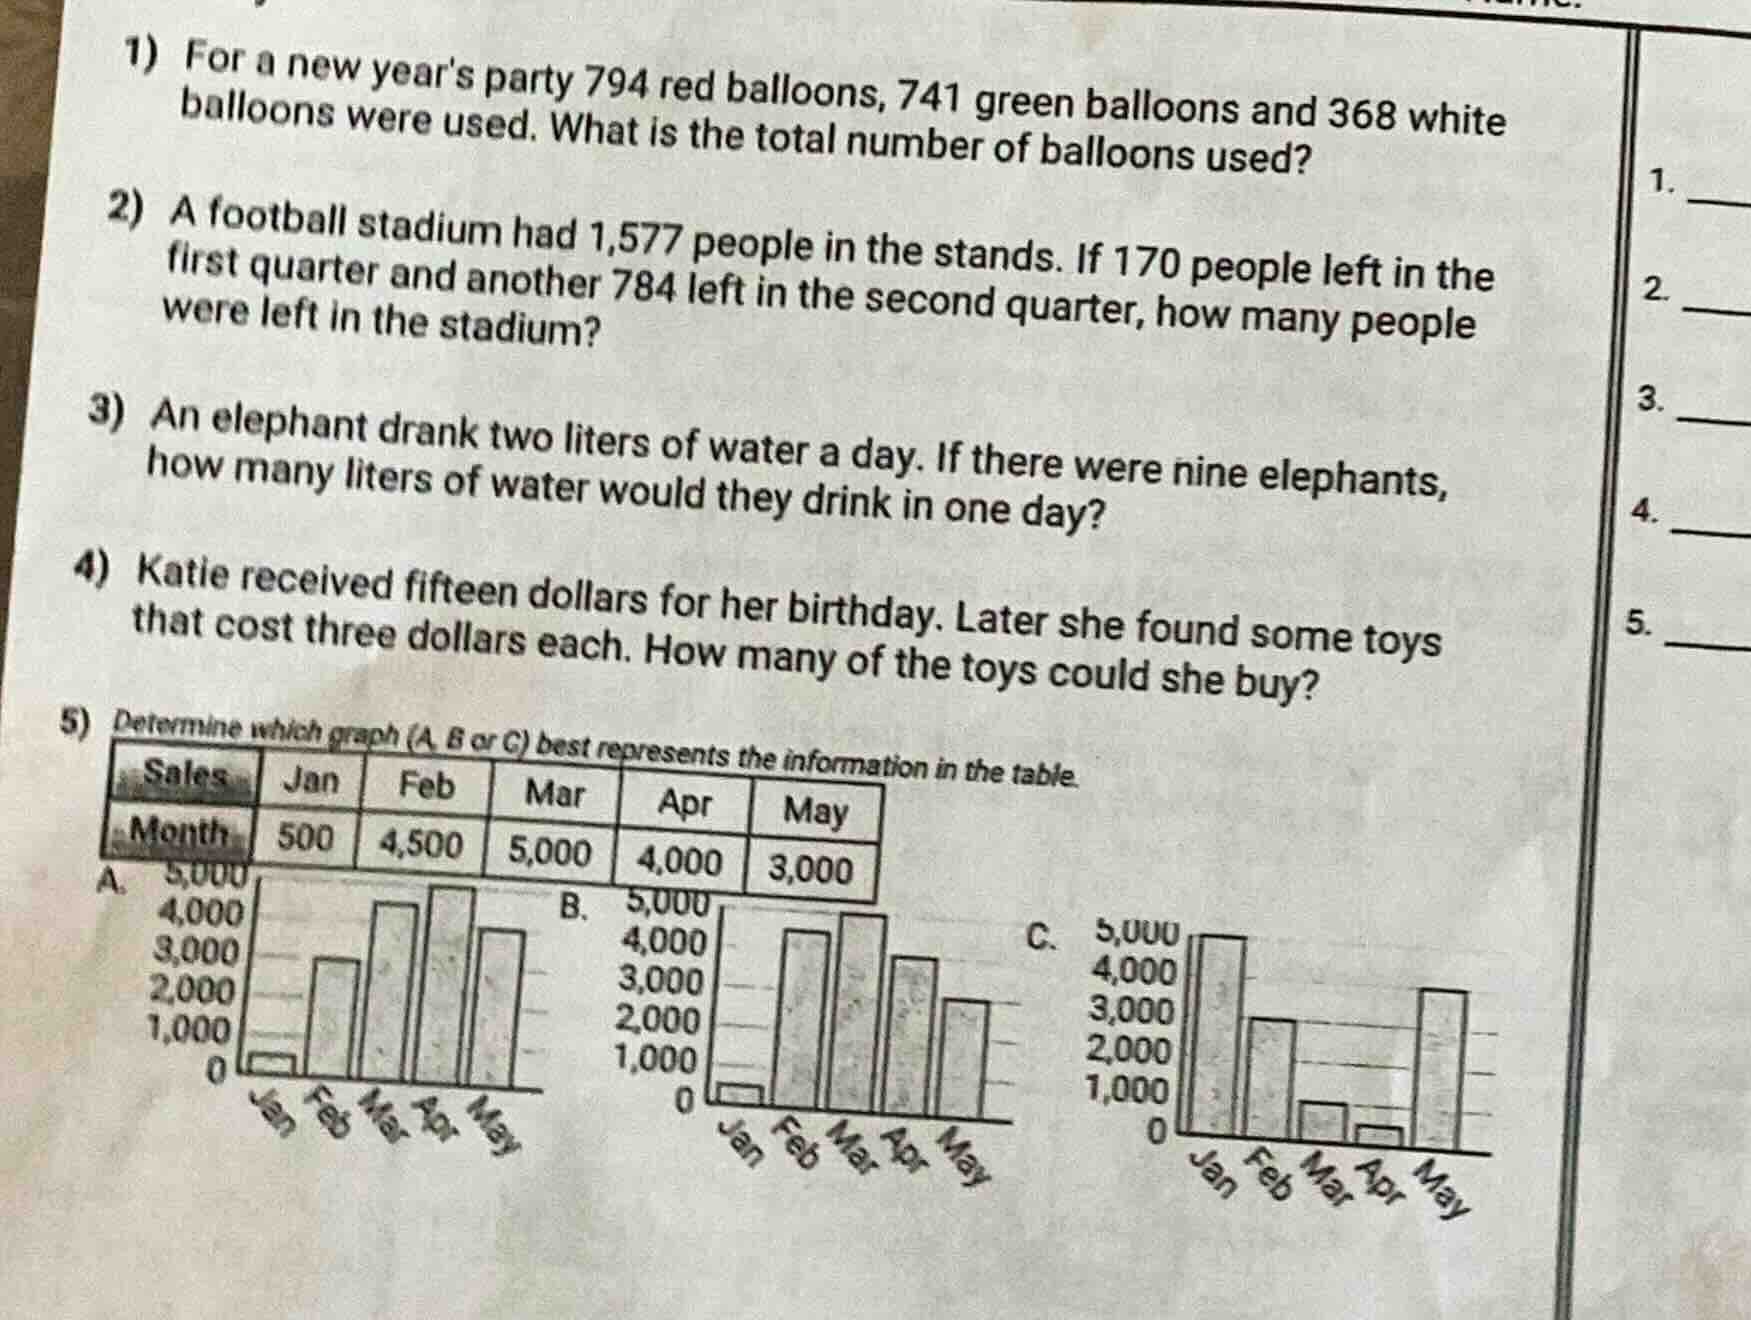
- determine which graph (a, b or c) best represents the information in the table.
| sales month | jan | feb | mar | apr | may |
|---|
a. bar graph with jan: ~500, feb: ~3000, mar: ~4500, apr: ~5000, may: ~4000
b. bar graph with jan: ~500, feb: ~4500, mar: ~5000, apr: ~4000, may: ~3000
c. bar graph with jan: ~5000, feb: ~3000, mar: ~500, apr: ~0, may: ~4000
Step1: Sum all balloon counts
$794 + 741 + 368$
Step2: Calculate first sum
$794 + 741 = 1535$
Step3: Add remaining balloon count
$1535 + 368 = 1903$
Step1: Sum people who left
$170 + 784$
Step2: Calculate total people who left
$170 + 784 = 954$
Step3: Subtract from initial count
$1577 - 954 = 623$
Step1: Multiply elephants by daily water
$2 \times 9$
Step2: Calculate total water
$2 \times 9 = 18$
Step1: Divide total money by toy cost
$\frac{15}{3}$
Step2: Calculate number of toys
$\frac{15}{3} = 5$
Step1: Match table values to graphs
Jan:500, Feb:4500, Mar:5000, Apr:4000, May:3000. Compare to Graph A's bar heights.

Snap & solve any problem in the app
Get step-by-step solutions on Sovi AI
Photo-based solutions with guided steps
Explore more problems and detailed explanations
- 1903
- 623
- 18
- 5
- A. The bar graph with Jan: ~500, Feb: ~3000, Mar: ~4000, Apr: ~5000, May: ~3000