QUESTION IMAGE
Question
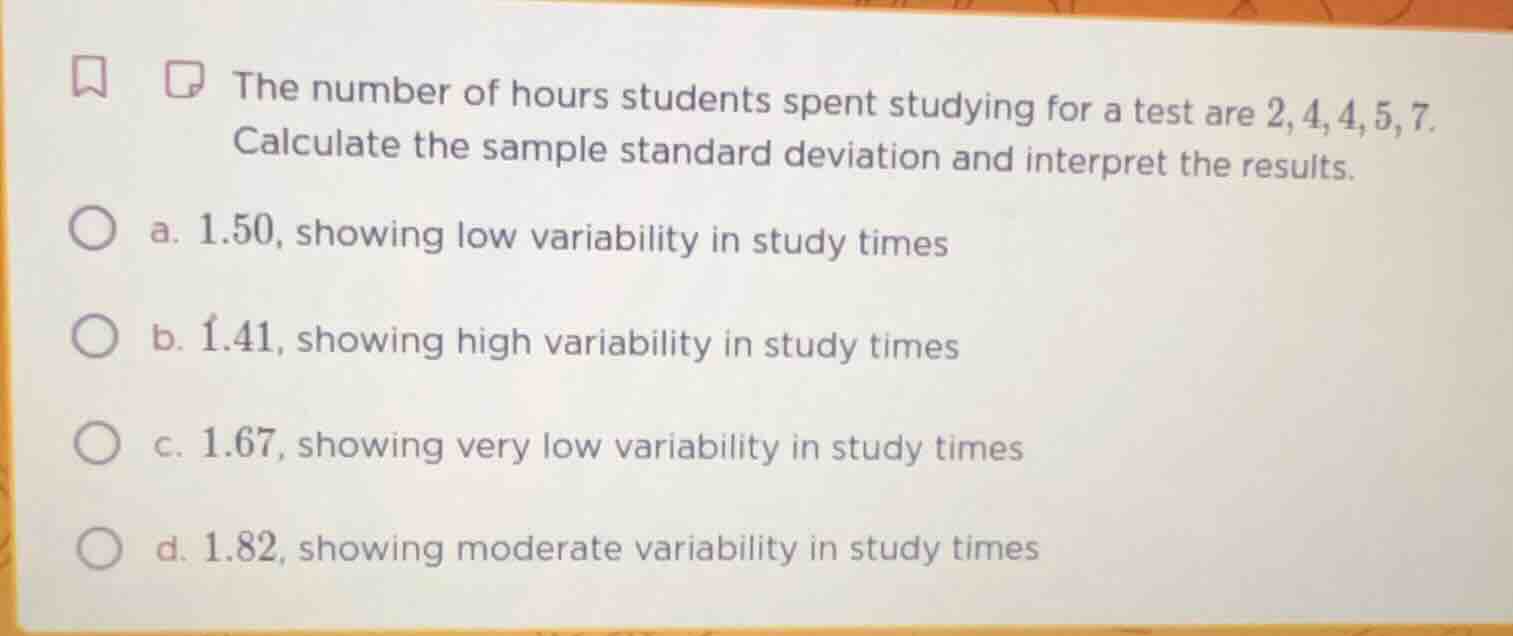
the number of hours students spent studying for a test are 2,4,4,5,7. calculate the sample standard deviation and interpret the results. a. 1.50, showing low variability in study times b. 1.41, showing high variability in study times c. 1.67, showing very low variability in study times d. 1.82, showing moderate variability in study times
Step1: Calculate the mean
The mean $\bar{x}$ is calculated as the sum of the data points divided by the number of data points. The data set is $2, 4, 4, 5, 7$. The sum is $2 + 4 + 4 + 5 + 7 = 22$. There are $n = 5$ data points. So, $\bar{x}=\frac{22}{5}=4.4$.
Step2: Calculate the squared differences from the mean
For each data point $x_i$, calculate $(x_i - \bar{x})^2$:
- For $x_1 = 2$: $(2 - 4.4)^2 = (-2.4)^2 = 5.76$
- For $x_2 = 4$: $(4 - 4.4)^2 = (-0.4)^2 = 0.16$
- For $x_3 = 4$: $(4 - 4.4)^2 = (-0.4)^2 = 0.16$
- For $x_4 = 5$: $(5 - 4.4)^2 = (0.6)^2 = 0.36$
- For $x_5 = 7$: $(7 - 4.4)^2 = (2.6)^2 = 6.76$
Step3: Calculate the sum of squared differences
Sum these squared differences: $5.76 + 0.16 + 0.16 + 0.36 + 6.76 = 13.2$.
Step4: Calculate the sample variance
The sample variance $s^2$ is given by $\frac{\sum (x_i - \bar{x})^2}{n - 1}$. Here, $n = 5$, so $n - 1 = 4$. Thus, $s^2=\frac{13.2}{4}=3.3$.
Step5: Calculate the sample standard deviation
The sample standard deviation $s$ is the square root of the sample variance. So, $s = \sqrt{3.3}\approx1.82$.
Step6: Interpret the result
A standard deviation of approximately $1.82$ indicates moderate variability in the study times because it's neither extremely small (which would indicate low variability) nor extremely large (which would indicate high variability).

Snap & solve any problem in the app
Get step-by-step solutions on Sovi AI
Photo-based solutions with guided steps
Explore more problems and detailed explanations
d. 1.82, showing moderate variability in study times