QUESTION IMAGE
Question
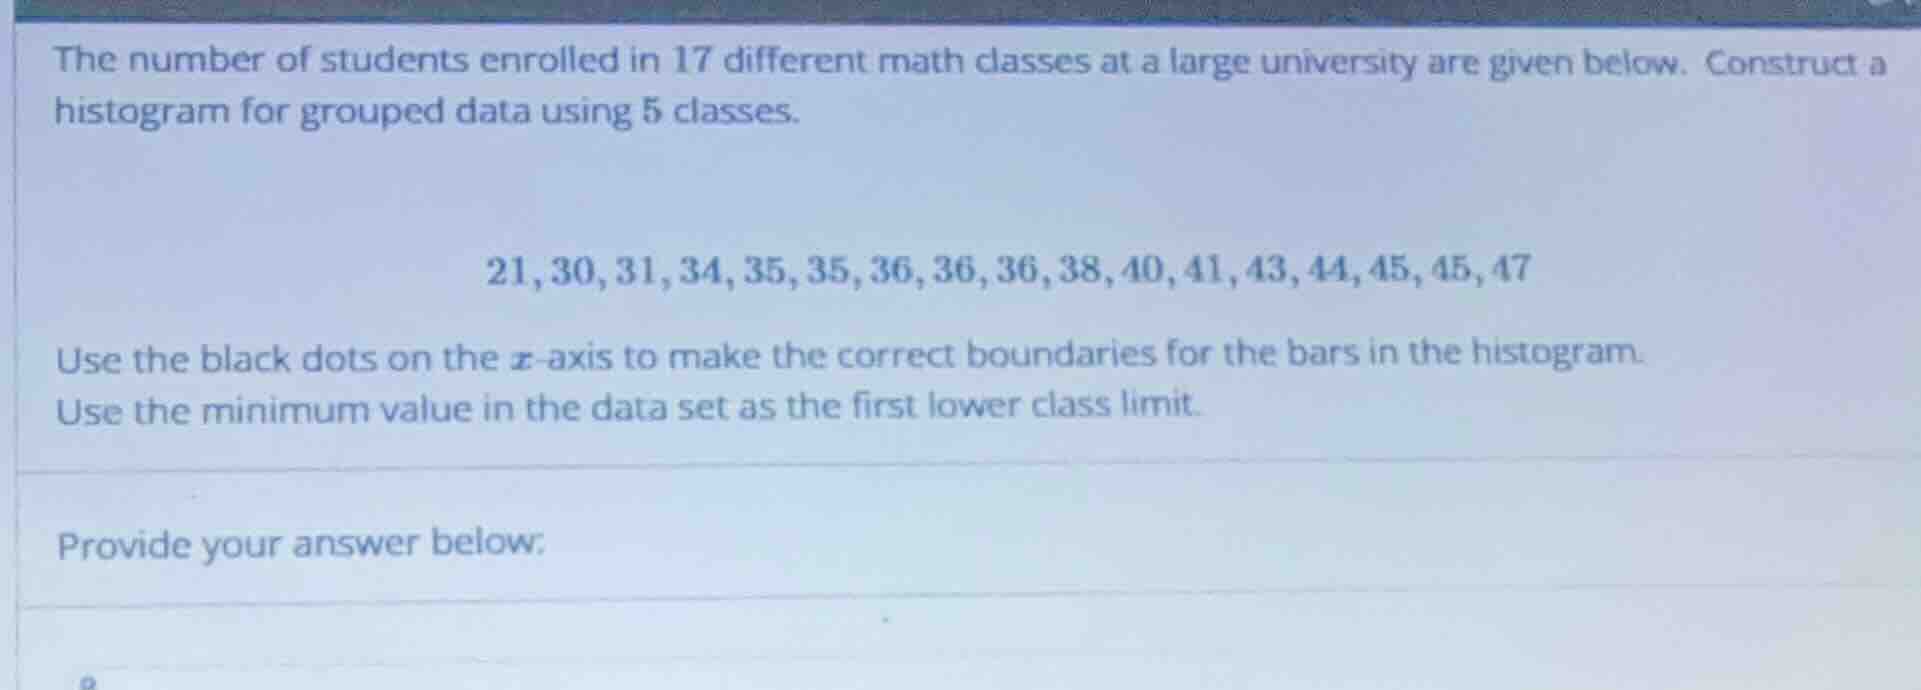
the number of students enrolled in 17 different math classes at a large university are given below. construct a histogram for grouped data using 5 classes. 21,30,31,34,35,35,36,36,36,38,40,41,43,44,45,45,47 use the black dots on the x-axis to make the correct boundaries for the bars in the histogram. use the minimum value in the data set as the first lower class limit. provide your answer below:
Step1: Find the range
First, we find the range of the data set. The minimum value is \(21\) and the maximum value is \(47\). The range \(R\) is calculated as \(R=\text{Maximum}-\text{Minimum}=47 - 21=26\).
Step2: Determine the class width
We are using \(5\) classes. The class width \(w\) is calculated by dividing the range by the number of classes and rounding up to a convenient number. So \(w=\lceil\frac{R}{n}
ceil=\lceil\frac{26}{5}
ceil=\lceil5.2
ceil = 6\) (we can also check if a smaller width works, but \(6\) is a good choice here).
Step3: Define the class limits
The first lower class limit is the minimum value, which is \(21\).
- Class 1: Lower limit \(= 21\), Upper limit \(=21 + 6- 1=26\) (since the class width is \(6\), the upper limit is lower limit \(+\) class width \(- 1\) for discrete data)
- Class 2: Lower limit \(=27\), Upper limit \(=27 + 6- 1 = 32\)
- Class 3: Lower limit \(=33\), Upper limit \(=33 + 6- 1=38\)
- Class 4: Lower limit \(=39\), Upper limit \(=39 + 6- 1=44\)
- Class 5: Lower limit \(=45\), Upper limit \(=45 + 6- 1=50\) (but our maximum data value is \(47\), so it will cover up to \(47\))
Step4: Count the frequency for each class
- Class 1 (\(21 - 26\)): The data values in this range are \(21\). So frequency \(f_1 = 1\)
- Class 2 (\(27 - 32\)): The data values are \(30,31\). So frequency \(f_2=2\)
- Class 3 (\(33 - 38\)): The data values are \(34,35,35,36,36,36,38\). So frequency \(f_3 = 7\)
- Class 4 (\(39 - 44\)): The data values are \(40,41,43,44\). So frequency \(f_4=4\)
- Class 5 (\(45 - 50\)): The data values are \(45,45,47\). So frequency \(f_5 = 3\)
To construct the histogram:
- The x - axis will have the class intervals: \(21 - 26\), \(27 - 32\), \(33 - 38\), \(39 - 44\), \(45 - 50\)
- The y - axis will have the frequency. The height of each bar corresponds to the frequency of each class. For example, the bar for \(21 - 26\) will have a height of \(1\), for \(27 - 32\) a height of \(2\), for \(33 - 38\) a height of \(7\), for \(39 - 44\) a height of \(4\), and for \(45 - 50\) a height of \(3\)

Snap & solve any problem in the app
Get step-by-step solutions on Sovi AI
Photo-based solutions with guided steps
Explore more problems and detailed explanations
The class intervals for the histogram are \(21 - 26\), \(27 - 32\), \(33 - 38\), \(39 - 44\), \(45 - 50\) with frequencies \(1\), \(2\), \(7\), \(4\), \(3\) respectively. The histogram will have bars centered (or with boundaries) at these intervals with heights equal to their frequencies.