QUESTION IMAGE
Question
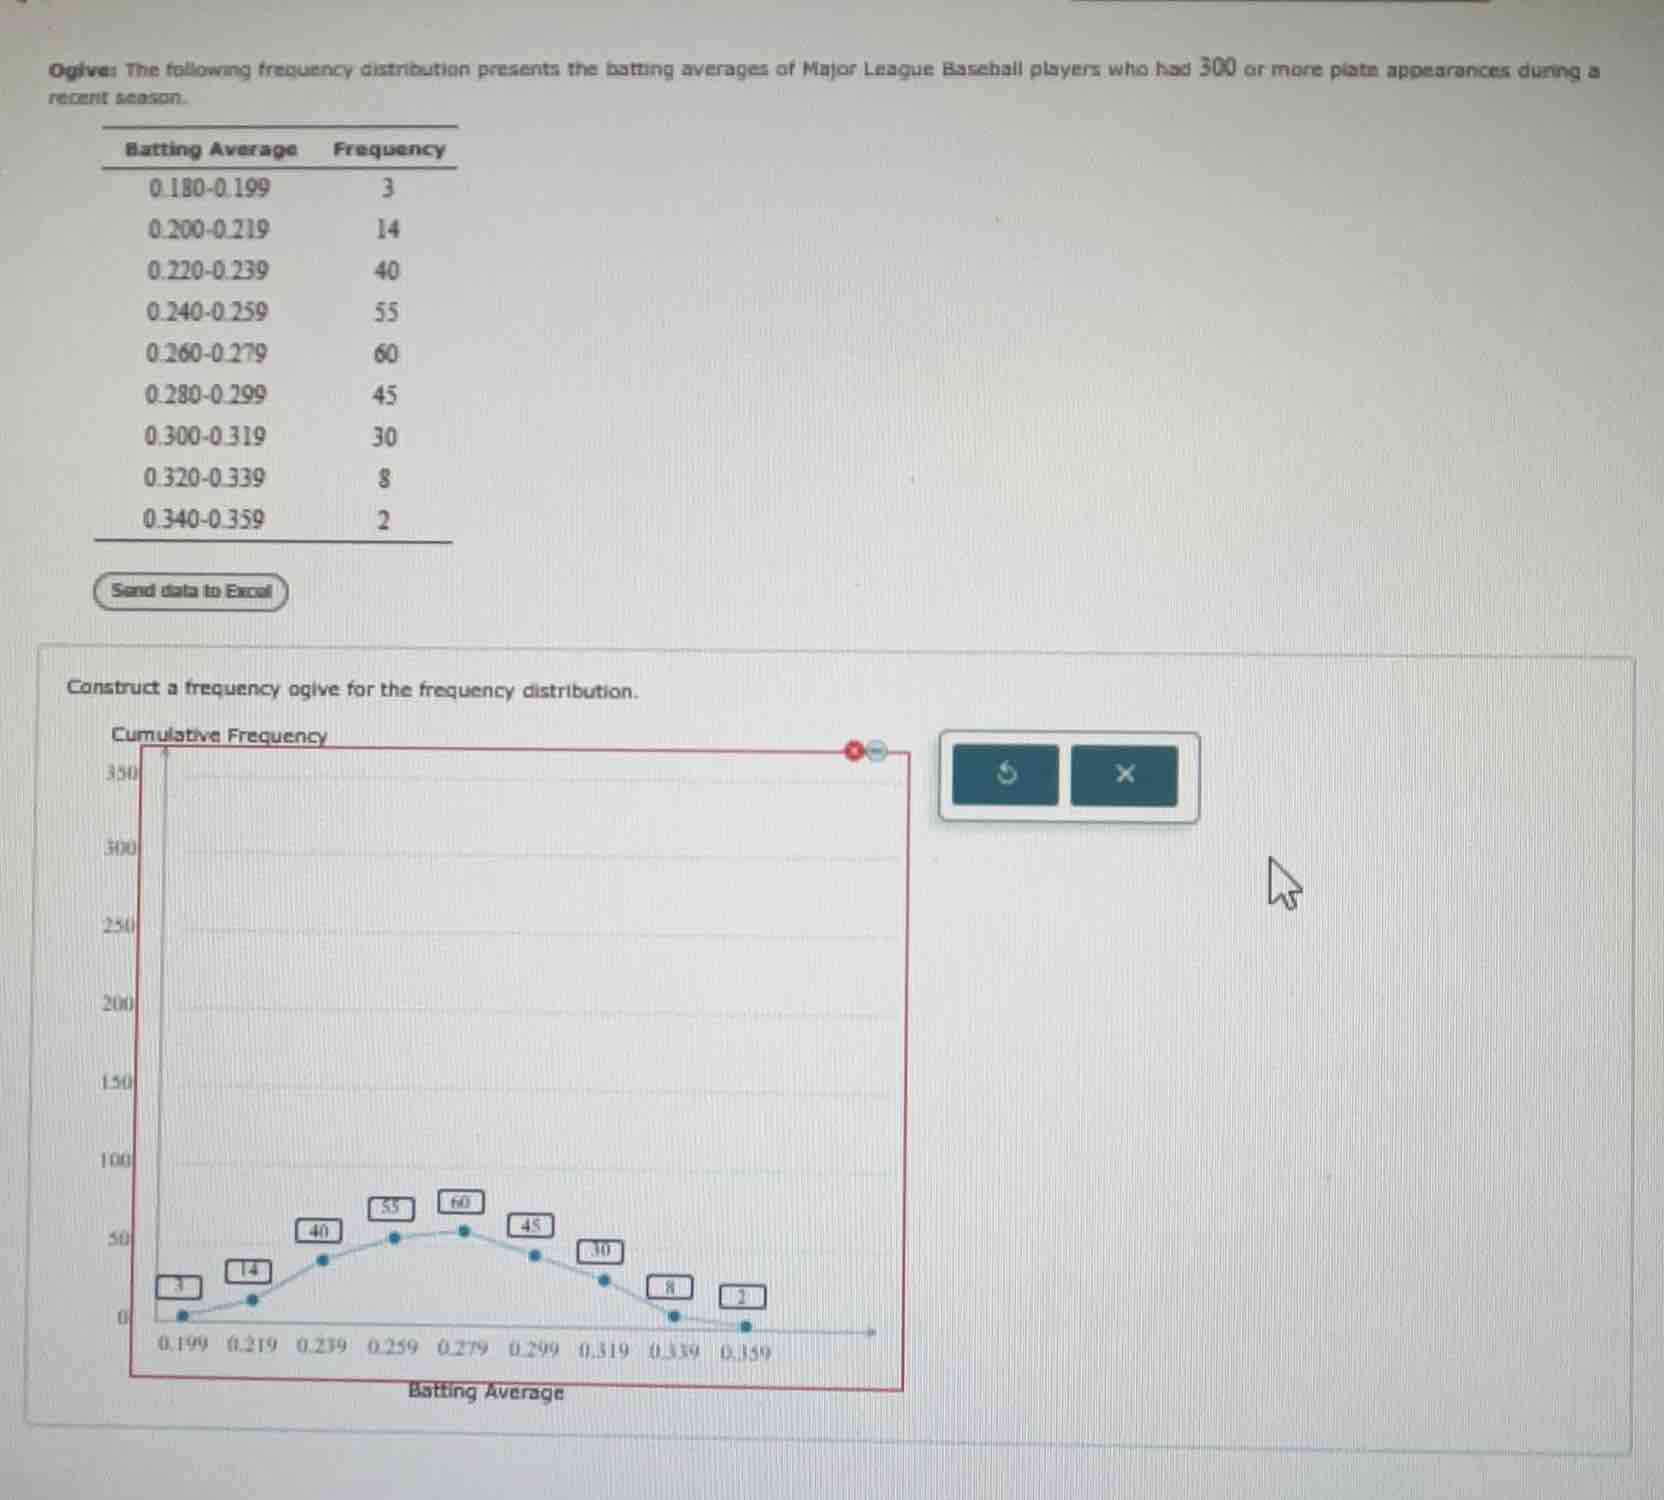
ogives: the following frequency distribution presents the batting averages of major league baseball players who had 300 or more plate appearances during a recent season.
batting average | frequency
0.180-0.199 | 3
0.200-0.219 | 14
0.220-0.239 | 40
0.240-0.259 | 55
0.260-0.279 | 60
0.280-0.299 | 45
0.300-0.319 | 30
0.320-0.339 | 8
0.340-0.359 | 2
send data to excel
construct a frequency ogive for the frequency distribution.

Snap & solve any problem in the app
Get step-by-step solutions on Sovi AI
Photo-based solutions with guided steps
Explore more problems and detailed explanations
The frequency ogive is constructed by plotting the cumulative frequencies at the upper class boundaries:
$(0.1795, 0)$, $(0.1995, 3)$, $(0.2195, 17)$, $(0.2395, 57)$, $(0.2595, 112)$, $(0.2795, 172)$, $(0.2995, 217)$, $(0.3195, 247)$, $(0.3395, 255)$, $(0.3595, 257)$.