QUESTION IMAGE
Question
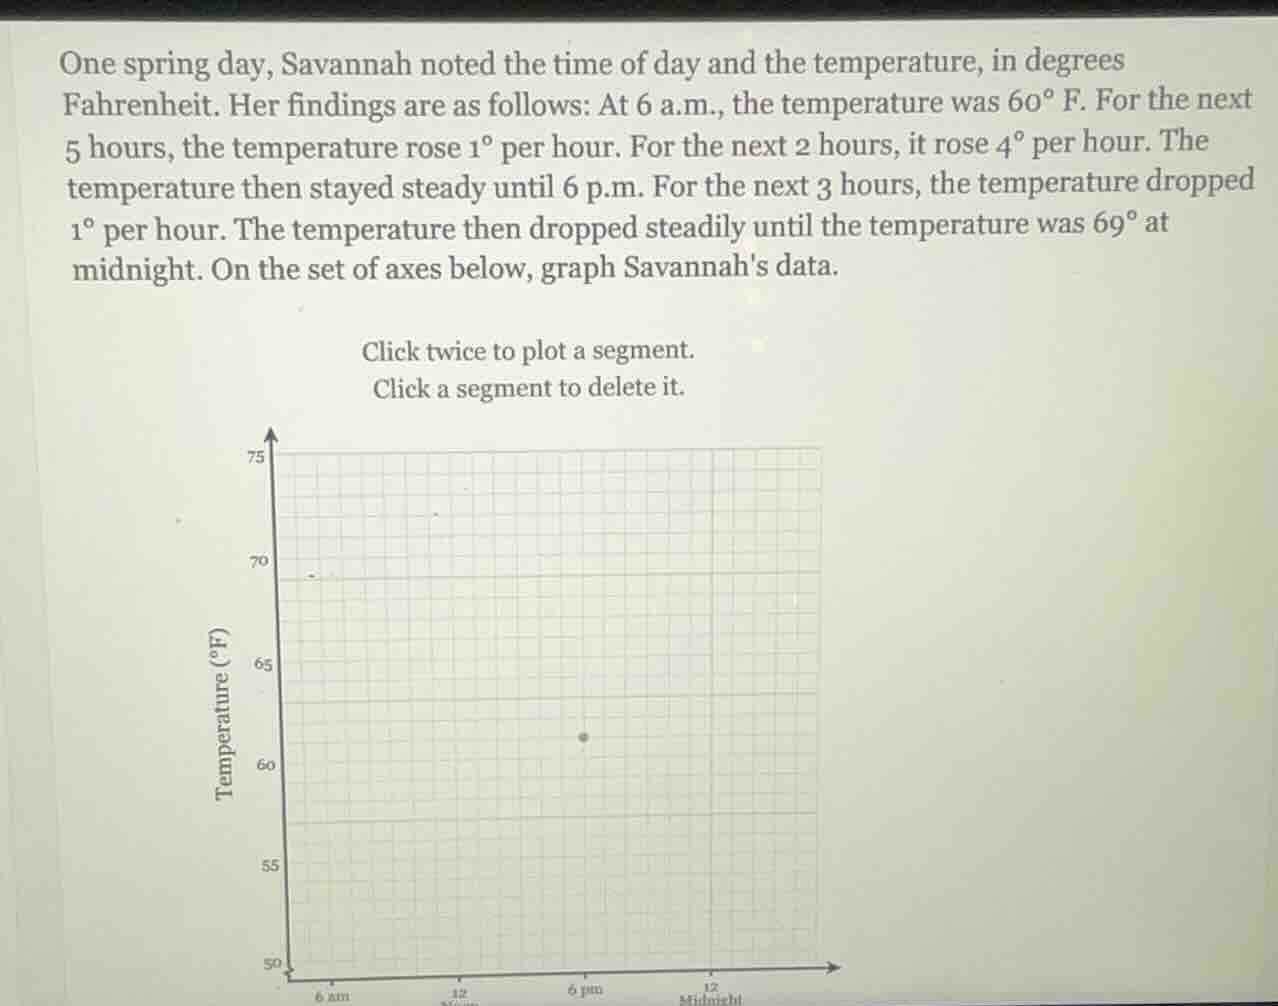
one spring day, savannah noted the time of day and the temperature, in degrees fahrenheit. her findings are as follows: at 6 a.m., the temperature was 60° f. for the next 5 hours, the temperature rose 1° per hour. for the next 2 hours, it rose 4° per hour. the temperature then stayed steady until 6 p.m. for the next 3 hours, the temperature dropped 1° per hour. the temperature then dropped steadily until the temperature was 69° at midnight. on the set of axes below, graph savannahs data. click twice to plot a segment. click a segment to delete it. temperature (°f) 50 55 60 65 70 75 6 am 6 pm 12 midnight
Step1: Determine time intervals and temperature changes
- 6 a.m. (time = 0 hours): Temperature \( T_0 = 60^\circ \text{F} \)
- Next 5 hours (until 11 a.m., time = 5 hours): Rise \( 1^\circ \) per hour. So \( T_5 = 60 + 5\times1 = 65^\circ \text{F} \)
- Next 2 hours (until 1 p.m., time = 7 hours): Rise \( 4^\circ \) per hour. So \( T_7 = 65 + 2\times4 = 73^\circ \text{F} \)
- Steady until 6 p.m. (time = 12 hours, since 6 a.m. to 6 p.m. is 12 hours): Temperature remains \( 73^\circ \text{F} \)
- Next 3 hours (until 9 p.m., time = 15 hours): Drop \( 1^\circ \) per hour. So \( T_{15} = 73 - 3\times1 = 70^\circ \text{F} \)
- From 9 p.m. (time = 15 hours) to midnight (time = 18 hours): Temperature drops from \( 70^\circ \text{F} \) to \( 69^\circ \text{F} \). The rate of drop is \( \frac{70 - 69}{18 - 15} = \frac{1}{3}^\circ \) per hour, but we can plot the points: (15, 70) and (18, 69)
Step2: Plot the points
- (0, 60) [6 a.m.]
- (5, 65) [11 a.m.]
- (7, 73) [1 p.m.]
- (12, 73) [6 p.m.]
- (15, 70) [9 p.m.]
- (18, 69) [midnight]
Then, connect the points with line segments:
- From (0, 60) to (5, 65) (slope 1)
- From (5, 65) to (7, 73) (slope 4)
- From (7, 73) to (12, 73) (horizontal line, slope 0)
- From (12, 73) to (15, 70) (slope -1)
- From (15, 70) to (18, 69) (slope \( -\frac{1}{3} \))

Snap & solve any problem in the app
Get step-by-step solutions on Sovi AI
Photo-based solutions with guided steps
Explore more problems and detailed explanations
To graph the data, plot the points \((0, 60)\), \((5, 65)\), \((7, 73)\), \((12, 73)\), \((15, 70)\), and \((18, 69)\) and connect them with line segments as described. The key points and their coordinates are used to create the graph showing the temperature changes over time.