QUESTION IMAGE
Question
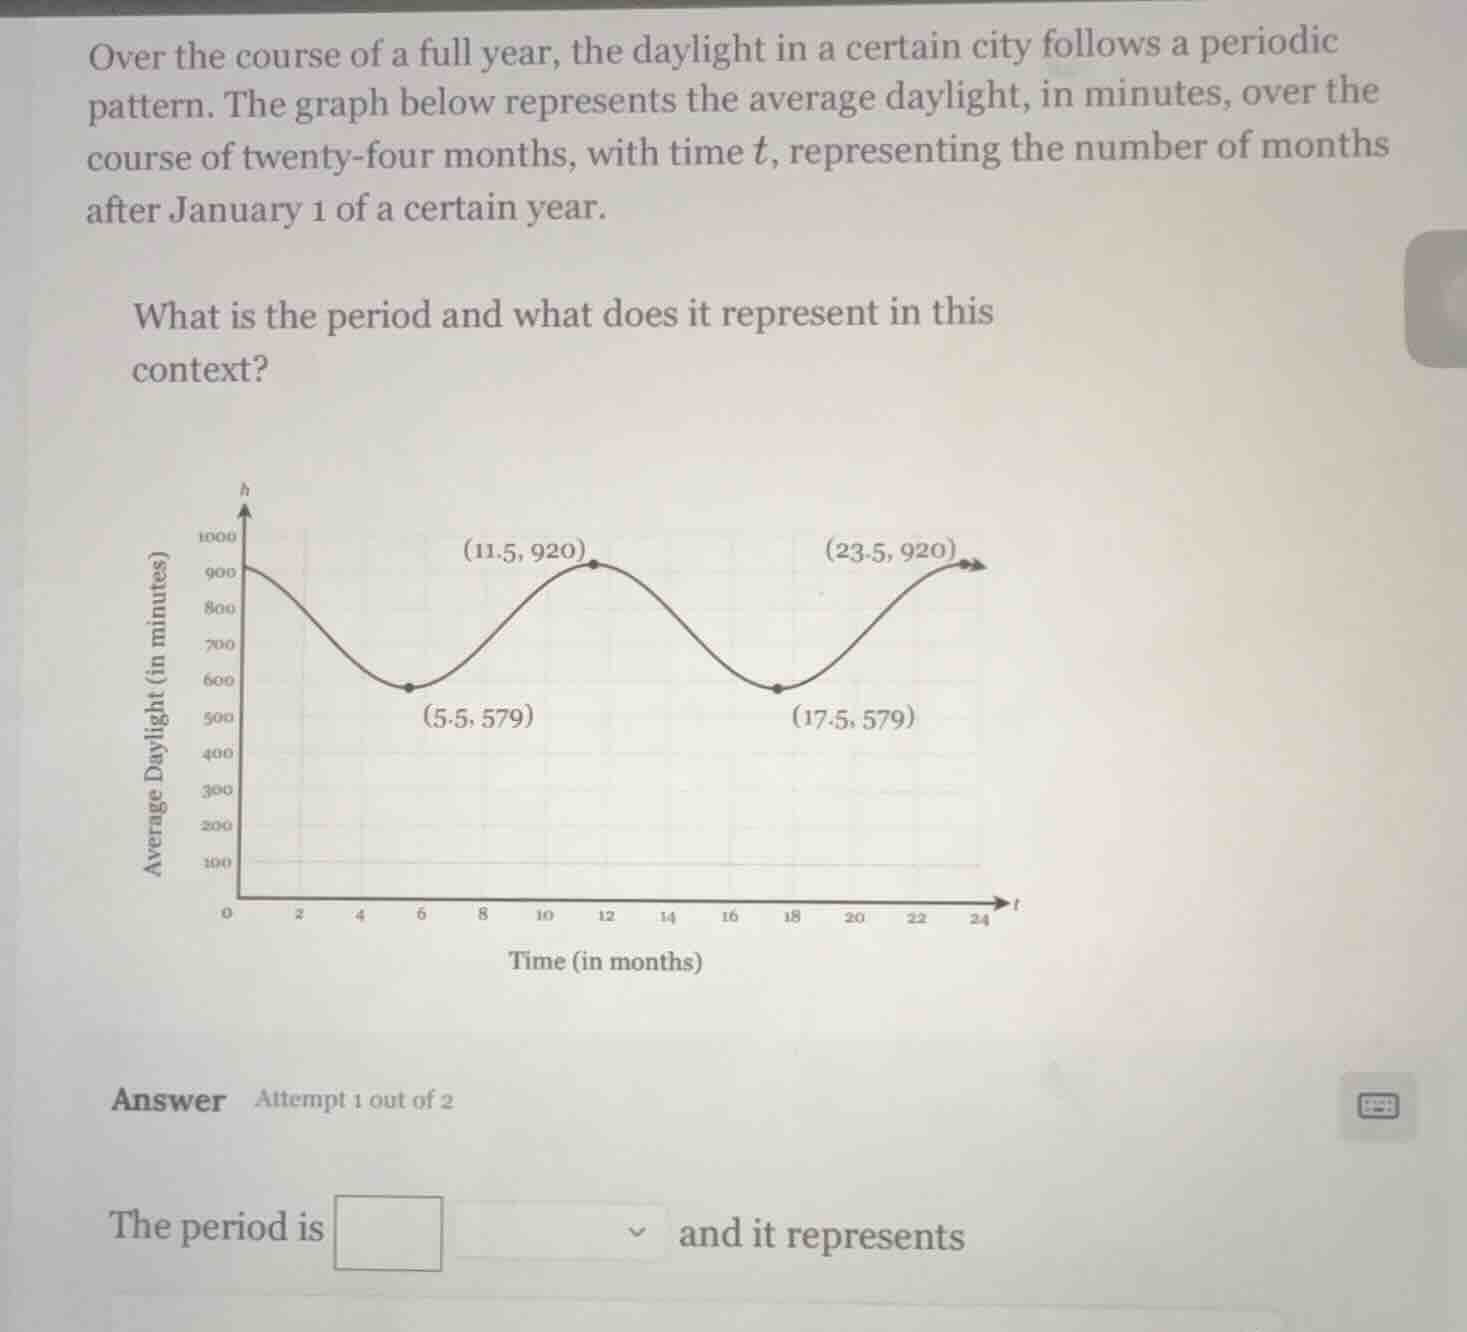
over the course of a full year, the daylight in a certain city follows a periodic pattern. the graph below represents the average daylight, in minutes, over the course of twenty - four months, with time t, representing the number of months after january 1 of a certain year. what is the period and what does it represent in this context? the period is and it represents
Step1: Identify period using peaks
The period is the horizontal distance between identical points on the periodic graph. Use the peak points $(11.5, 920)$ and $(23.5, 920)$.
$23.5 - 11.5 = 12$
Step2: Interpret period context
The input $t$ is months, so the period represents the time for the daylight pattern to repeat.

Snap & solve any problem in the app
Get step-by-step solutions on Sovi AI
Photo-based solutions with guided steps
Explore more problems and detailed explanations
The period is 12 and it represents the number of months it takes for the average daylight pattern to complete one full cycle and repeat.