QUESTION IMAGE
Question
part 1 of 2
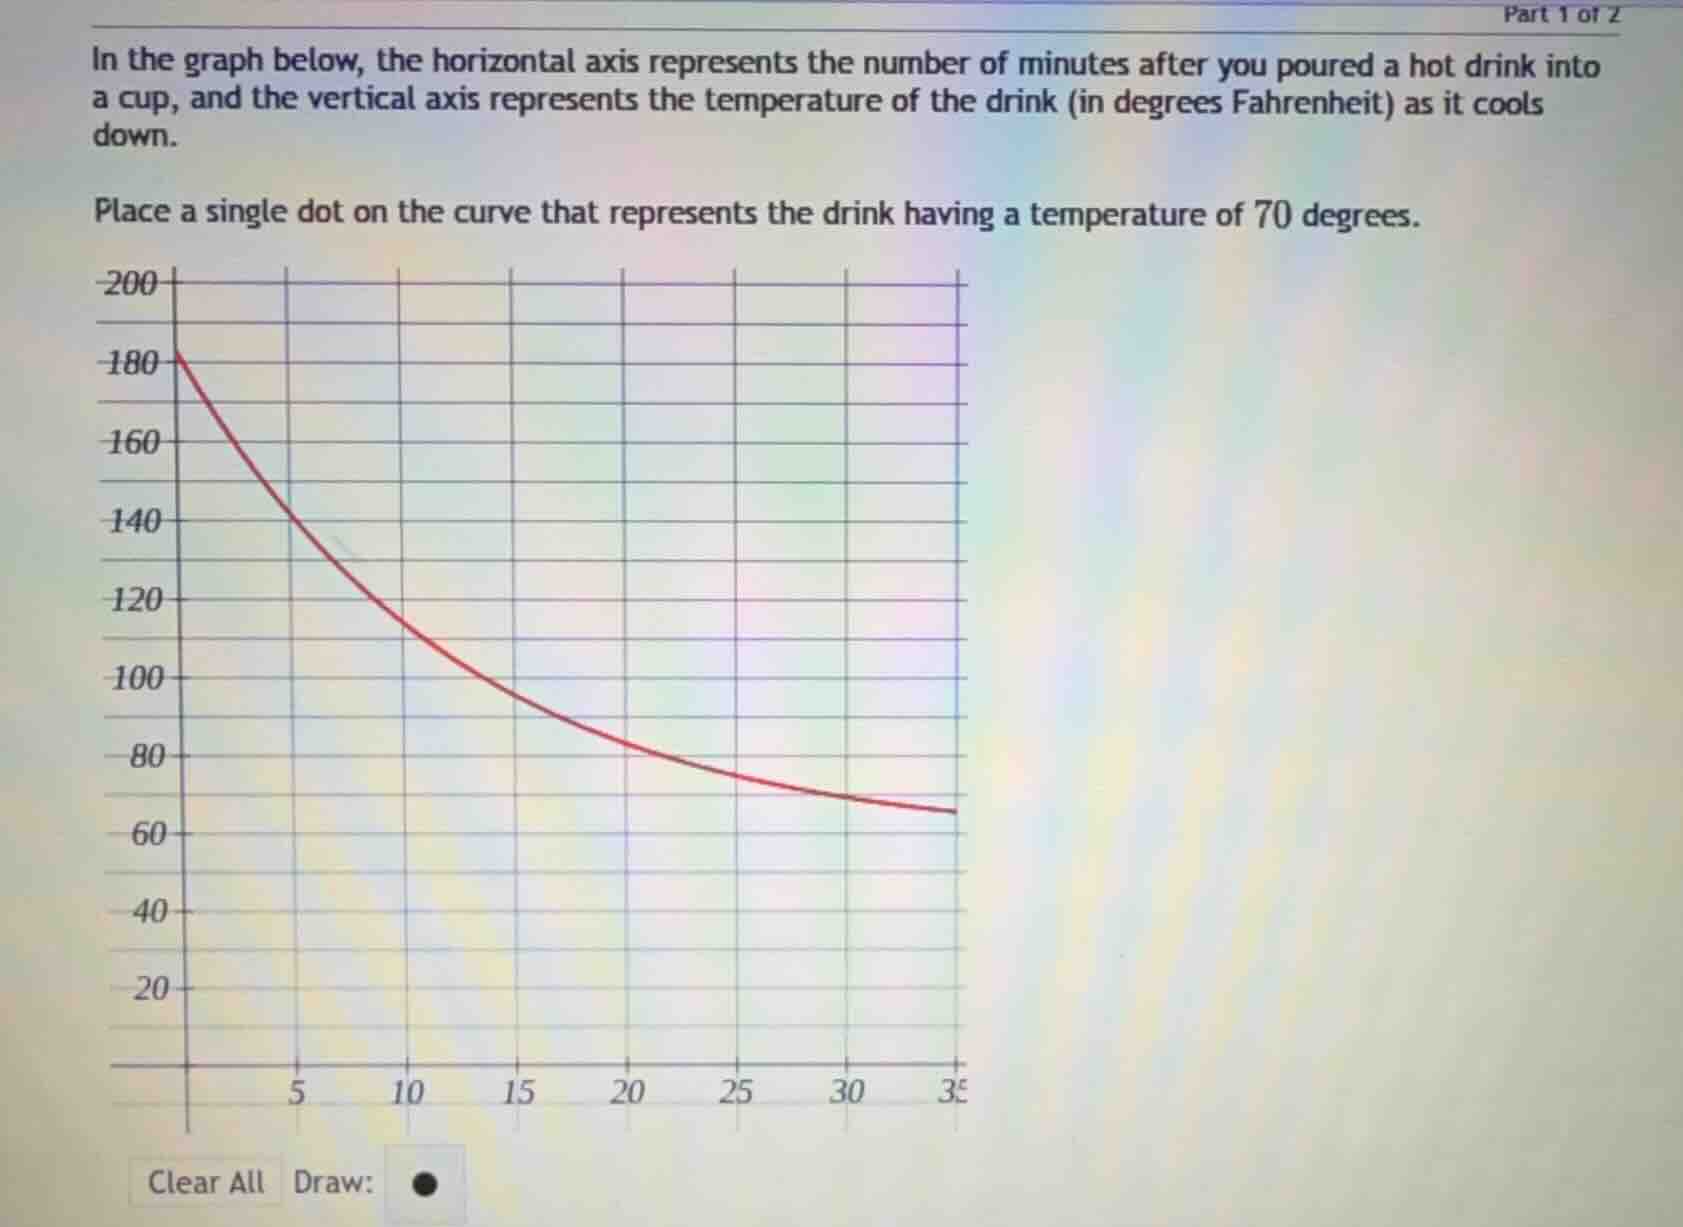
in the graph below, the horizontal axis represents the number of minutes after you poured a hot drink into a cup, and the vertical axis represents the temperature of the drink (in degrees fahrenheit) as it cools down.
place a single dot on the curve that represents the drink having a temperature of 70 degrees.
Step1: Identify the vertical axis value
The vertical axis is temperature (°F), so we look for the line corresponding to 70°F. Since the grid has lines at 60, 80, etc., 70 is halfway between 60 and 80.
Step2: Find the curve's position at 70°F
We move horizontally from the 70°F level (midway between 60 and 80) until we intersect the cooling curve. Then place a dot there.
(Note: In a graphical interface, you would visually locate the y - value of 70, find where the curve is at that y - value, and place the dot. For example, looking at the graph, between x = 30 and x = 35, and y between 60 and 80, the curve at y = 70 would be a point we mark. )

Snap & solve any problem in the app
Get step-by-step solutions on Sovi AI
Photo-based solutions with guided steps
Explore more problems and detailed explanations
(The dot should be placed on the curve at the (x, y) where y = 70 (visually, between x = 30 - 35 and y midway between 60 and 80 on the curve). In the graph, this is a point on the red curve corresponding to temperature 70°F.)