QUESTION IMAGE
Question
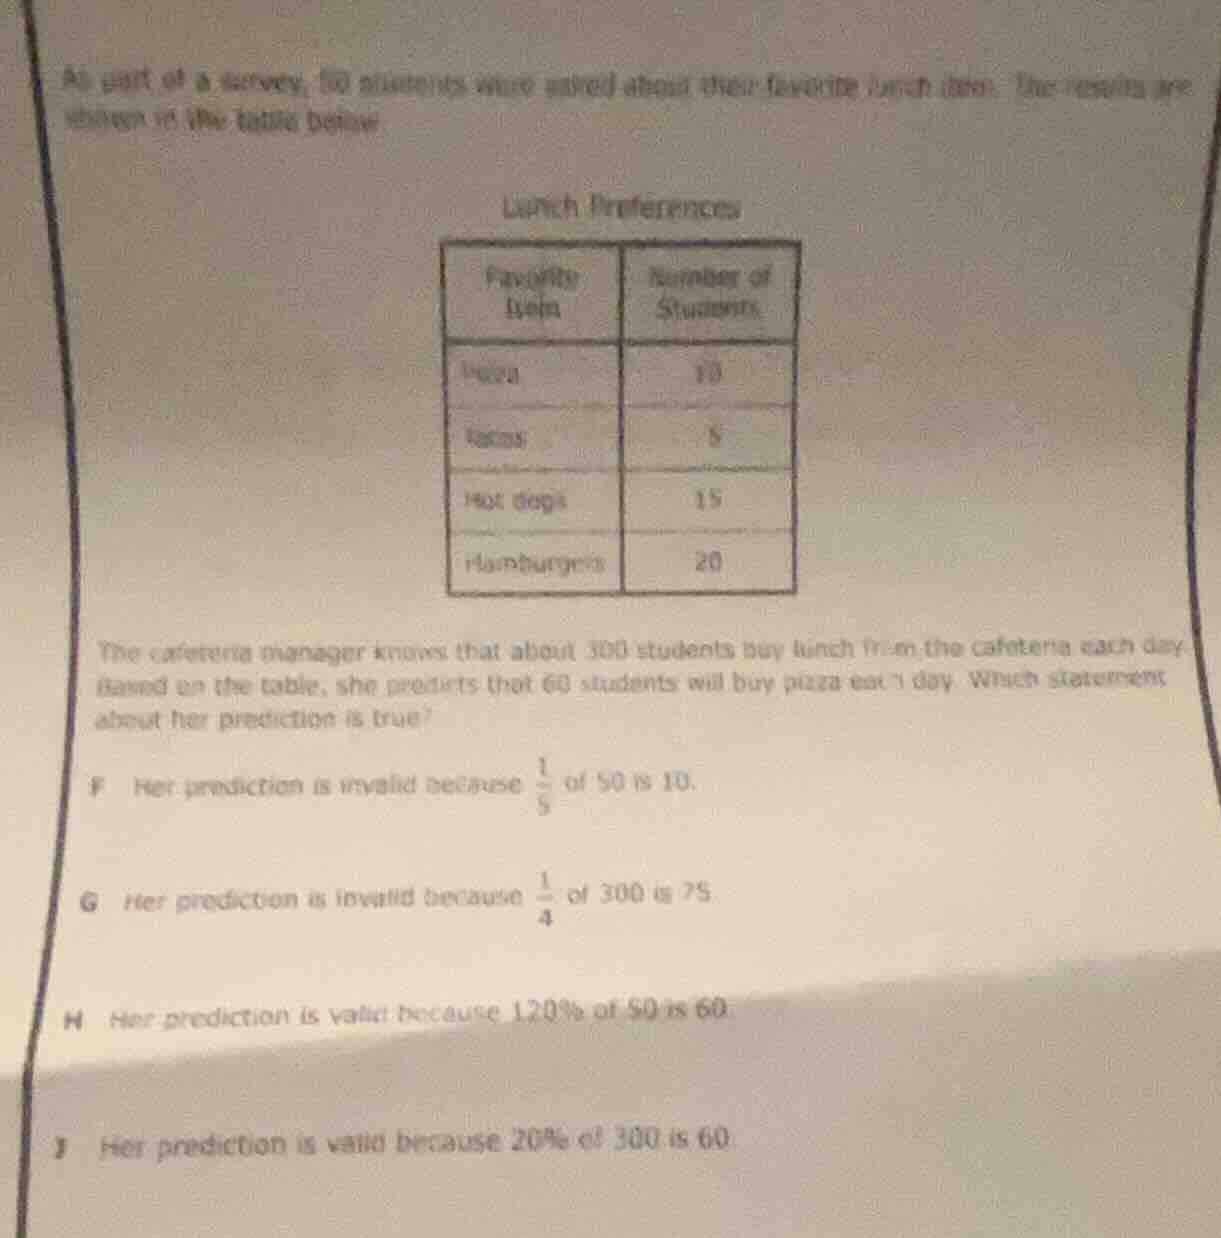
as part of a survey, 50 students were asked about their favorite lunch item. the results are shown in the table below:
lunch preferences
| favorite item | number of students |
|---|---|
| tacos | 5 |
| hot dogs | 15 |
| hamburgers | 20 |
the cafeteria manager knows that about 300 students buy lunch from the cafeteria each day. based on the table, she predicts that 60 students will buy pizza each day. which statement about her prediction is true?
f her prediction is invalid because \\(\frac{1}{5}\\) of 50 is 10.
g her prediction is invalid because \\(\frac{1}{4}\\) of 300 is 75
h her prediction is valid because 120% of 50 is 60.
j her prediction is valid because 20% of 300 is 60.
Step1: Calculate the proportion of students who like pizza in the survey
In the survey of 50 students, 10 like pizza. So the proportion is $\frac{10}{50} = 0.2$ or 20%.
Step2: Apply this proportion to the total number of students (300)
To find the predicted number of students who buy pizza, we calculate 20% of 300. Mathematically, that is $0.2\times300 = 60$. So the prediction is valid because 20% of 300 is 60.
Now let's analyze the other options:
- Option F: The fact that $\frac{1}{5}$ of 50 is 10 is just the count in the survey, not related to the validity of the prediction for 300 students. So F is incorrect.
- Option G: $\frac{1}{4}$ of 300 is 75, but this is not related to the proportion of pizza - lovers in the survey. So G is incorrect.
- Option H: 120% of 50 is $1.2\times50 = 60$, but we should apply the proportion from the survey (20%) to the total number of 300, not 120% of 50. So H is incorrect.

Snap & solve any problem in the app
Get step-by-step solutions on Sovi AI
Photo-based solutions with guided steps
Explore more problems and detailed explanations
J. Her prediction is valid because 20% of 300 is 60.