QUESTION IMAGE
Question
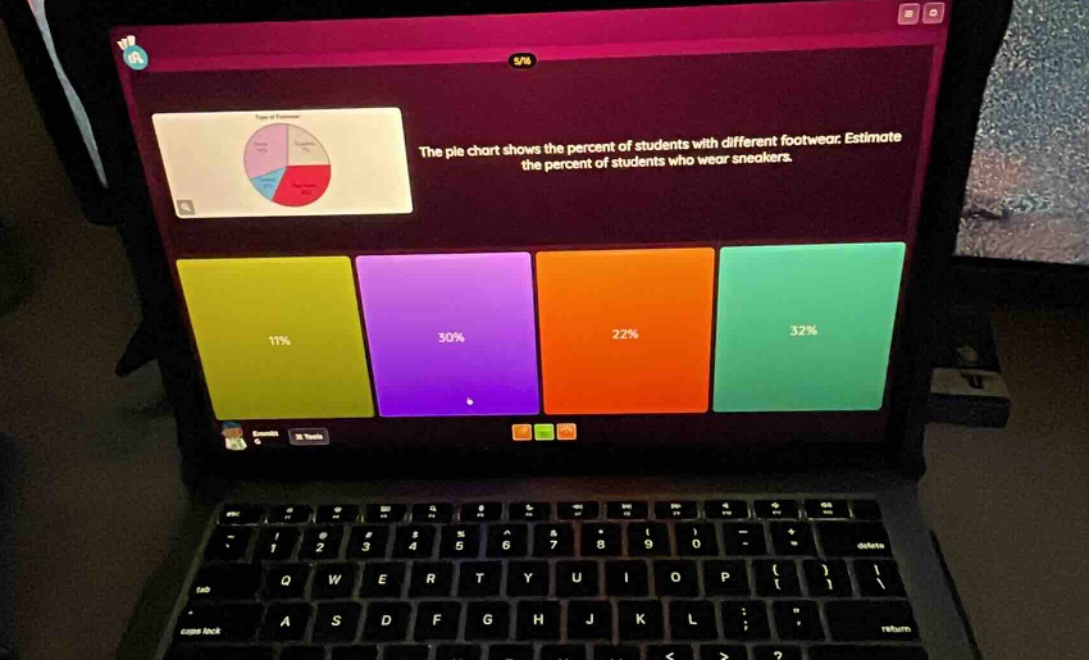
the pie chart shows the percent of students with different footwear. estimate the percent of students who wear sneakers. 11% 30% 22% 32%
Step1: Analyze pie chart segments
Observe the red segment (sneakers) is the largest, close to 1/3 of the circle.
Step2: Match to percentage options
$\frac{1}{3} \approx 33\%$, which is closest to 32%.

Snap & solve any problem in the app
Get step-by-step solutions on Sovi AI
Photo-based solutions with guided steps
Explore more problems and detailed explanations
32%