QUESTION IMAGE
Question
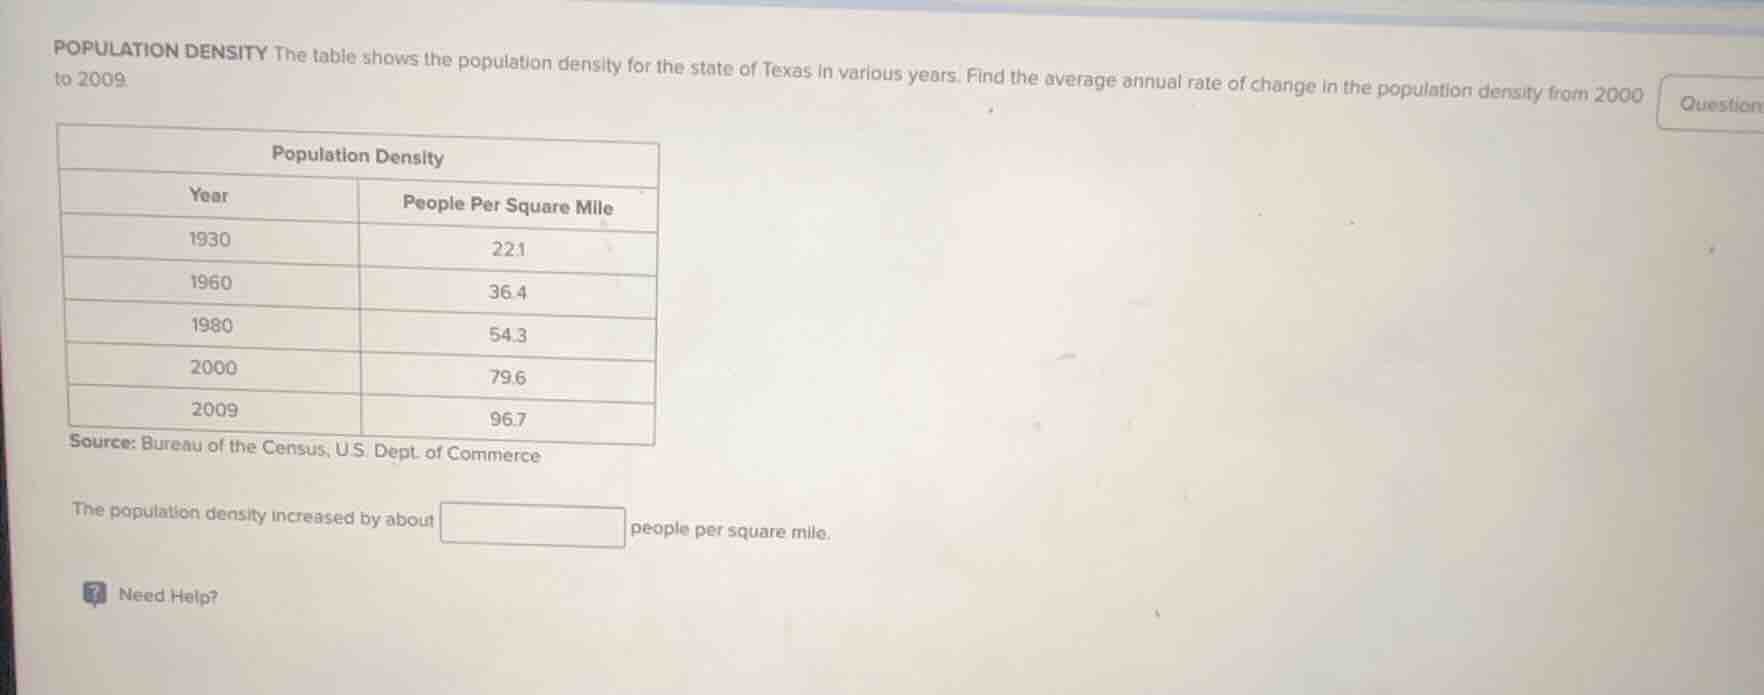
population density the table shows the population density for the state of texas in various years. find the average annual rate of change in the population density from 2000 to 2009.
| population density |
| year | people per square mile |
| 1930 | 22.1 |
| 1960 | 36.4 |
| 1980 | 54.3 |
| 2000 | 79.6 |
| 2009 | 96.7 |
source: bureau of the census, u.s. dept. of commerce
the population density increased by about \boxed{} people per square mile.
need help?
Step1: Identify the formula for average rate of change
The formula for the average rate of change of a quantity \( y \) with respect to time \( t \) is \( \frac{\Delta y}{\Delta t}=\frac{y_2 - y_1}{t_2 - t_1} \), where \( y_1,y_2 \) are the initial and final values of the quantity and \( t_1,t_2 \) are the initial and final times.
Step2: Identify the values for 2000 and 2009
For \( t_1 = 2000 \), \( y_1=79.6 \) (people per square mile) and for \( t_2 = 2009 \), \( y_2 = 96.7 \) (people per square mile). The time difference \( \Delta t=t_2 - t_1=2009 - 2000 = 9 \) years. The change in population density \( \Delta y=y_2 - y_1=96.7 - 79.6=17.1 \) people per square mile.
Step3: Calculate the average annual rate of change
Using the formula \( \frac{\Delta y}{\Delta t} \), we substitute the values: \( \frac{17.1}{9}=1.9 \)

Snap & solve any problem in the app
Get step-by-step solutions on Sovi AI
Photo-based solutions with guided steps
Explore more problems and detailed explanations
\( 1.9 \)