QUESTION IMAGE
Question
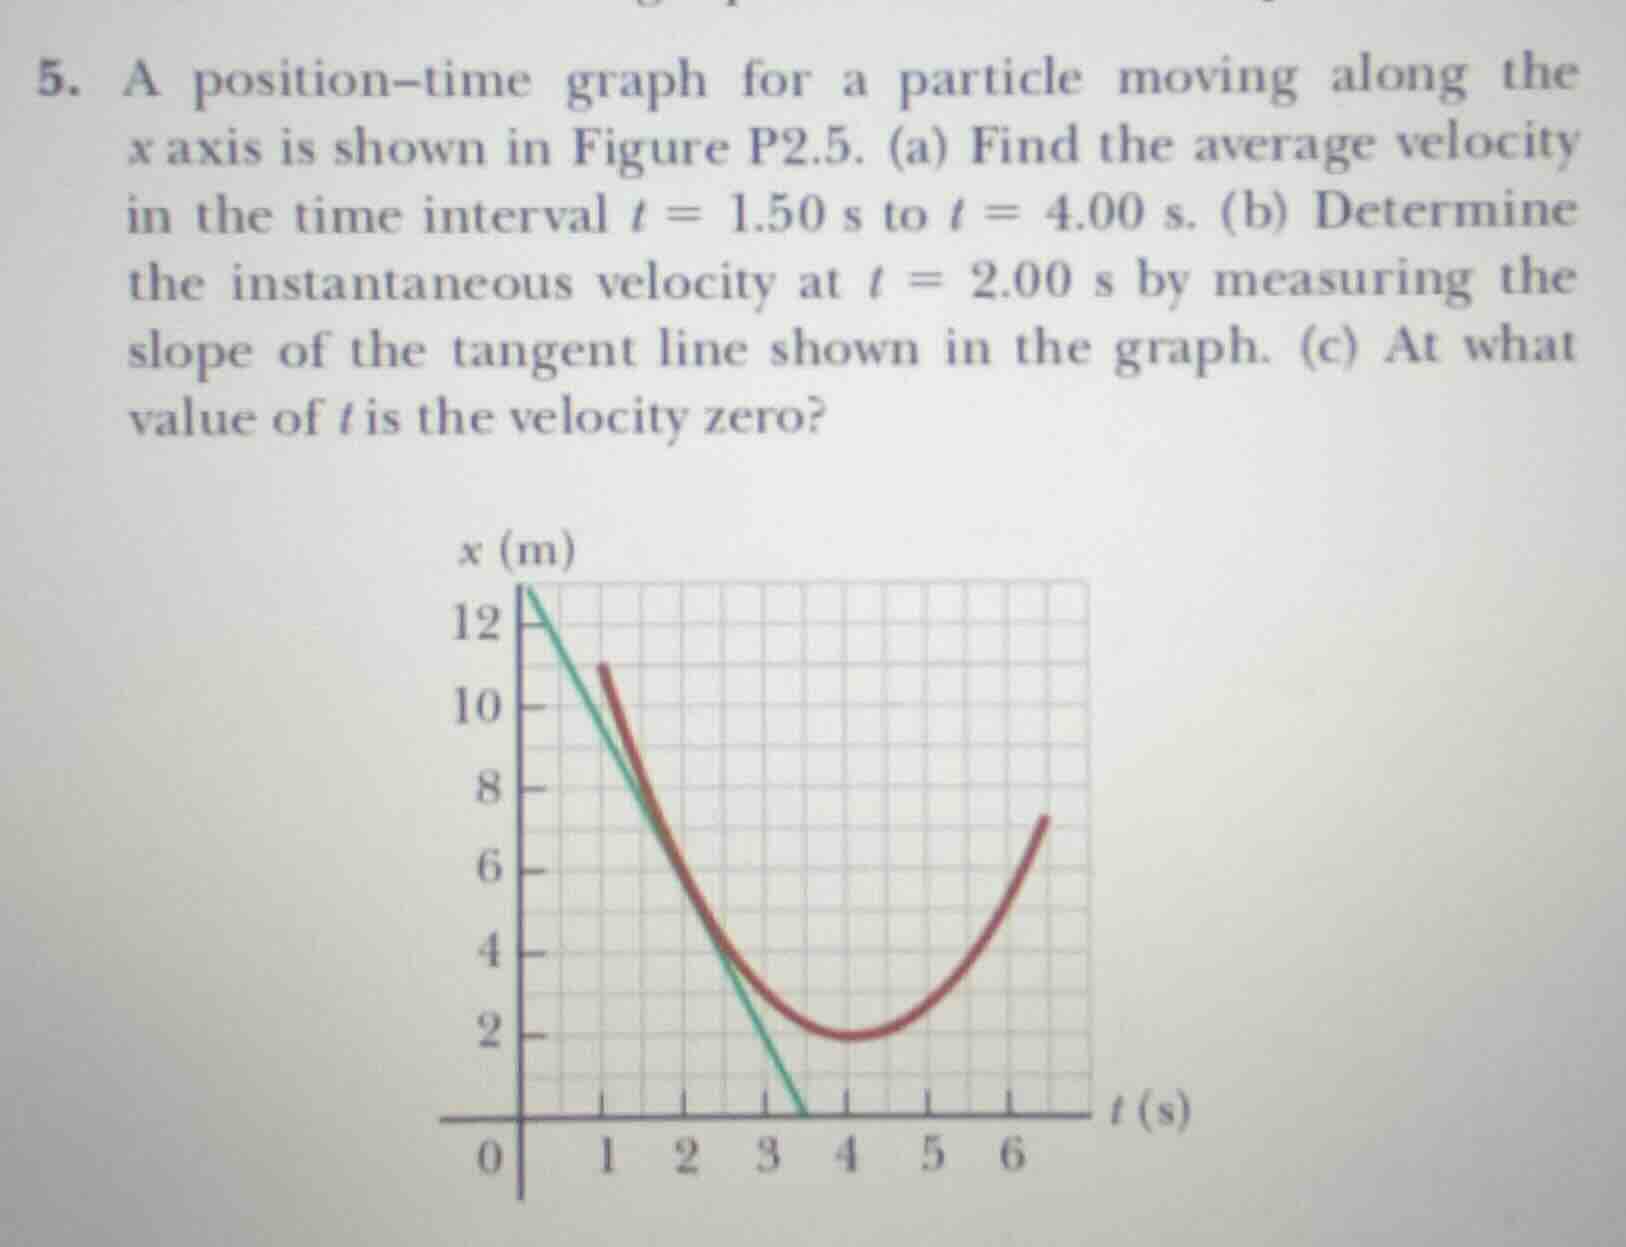
- a position-time graph for a particle moving along the x axis is shown in figure p2.5. (a) find the average velocity in the time interval t = 1.50 s to t = 4.00 s. (b) determine the instantaneous velocity at t = 2.00 s by measuring the slope of the tangent line shown in the graph. (c) at what value of t is the velocity zero?
Step1: Define average velocity formula
Average velocity: $\bar{v} = \frac{x_f - x_i}{t_f - t_i}$
Step2: Identify values for (a)
At $t_i=1.50\ \text{s}$, $x_i=8.0\ \text{m}$; at $t_f=4.00\ \text{s}$, $x_f=2.0\ \text{m}$
Step3: Calculate average velocity (a)
$\bar{v} = \frac{2.0\ \text{m} - 8.0\ \text{m}}{4.00\ \text{s} - 1.50\ \text{s}} = \frac{-6.0\ \text{m}}{2.50\ \text{s}} = -2.4\ \text{m/s}$
Step4: Calculate tangent slope for (b)
Tangent (green line): $x_i=13.0\ \text{m}$ at $t_i=0$, $x_f=0$ at $t_f=3.50\ \text{s}$
$v = \frac{0 - 13.0\ \text{m}}{3.50\ \text{s} - 0} \approx -3.7\ \text{m/s}$
Step5: Find zero velocity time (c)
Velocity = 0 at graph's minimum, $t=4.0\ \text{s}$

Snap & solve any problem in the app
Get step-by-step solutions on Sovi AI
Photo-based solutions with guided steps
Explore more problems and detailed explanations
(a) $\boldsymbol{-2.4\ \text{m/s}}$
(b) $\boldsymbol{-3.7\ \text{m/s}}$ (approximate, based on tangent slope)
(c) $\boldsymbol{4.0\ \text{s}}$