QUESTION IMAGE
Question
practice analyzing quantitative relationships.
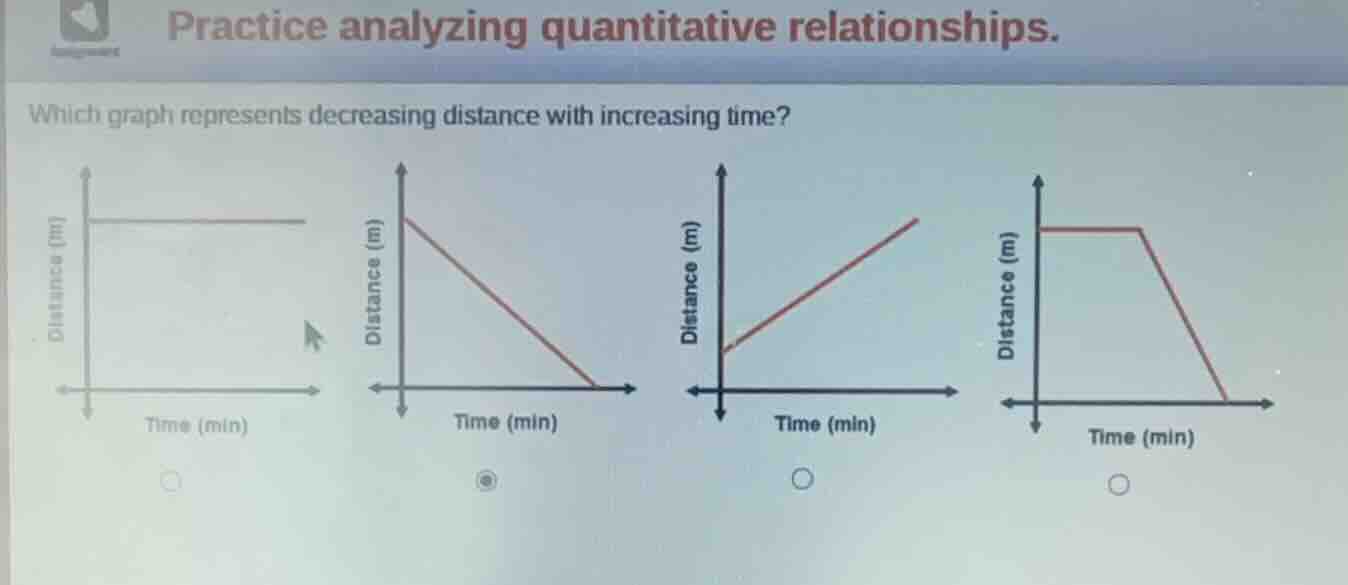
which graph represents decreasing distance with increasing time?
Brief Explanations
We need a graph where as the horizontal axis (time) increases, the vertical axis (distance) decreases.
- First graph: Distance stays constant as time increases.
- Second graph: Distance decreases continuously as time increases, matching the requirement.
- Third graph: Distance increases as time increases.
- Fourth graph: Distance stays constant first, then decreases.
The question asks for decreasing distance with increasing time, and the second graph shows this relationship consistently from the start.

Snap & solve any problem in the app
Get step-by-step solutions on Sovi AI
Photo-based solutions with guided steps
Explore more problems and detailed explanations
B. The second graph (with a downward-sloping line from the top-left to bottom-right, where distance starts at a positive value and decreases to 0 as time increases)