QUESTION IMAGE
Question
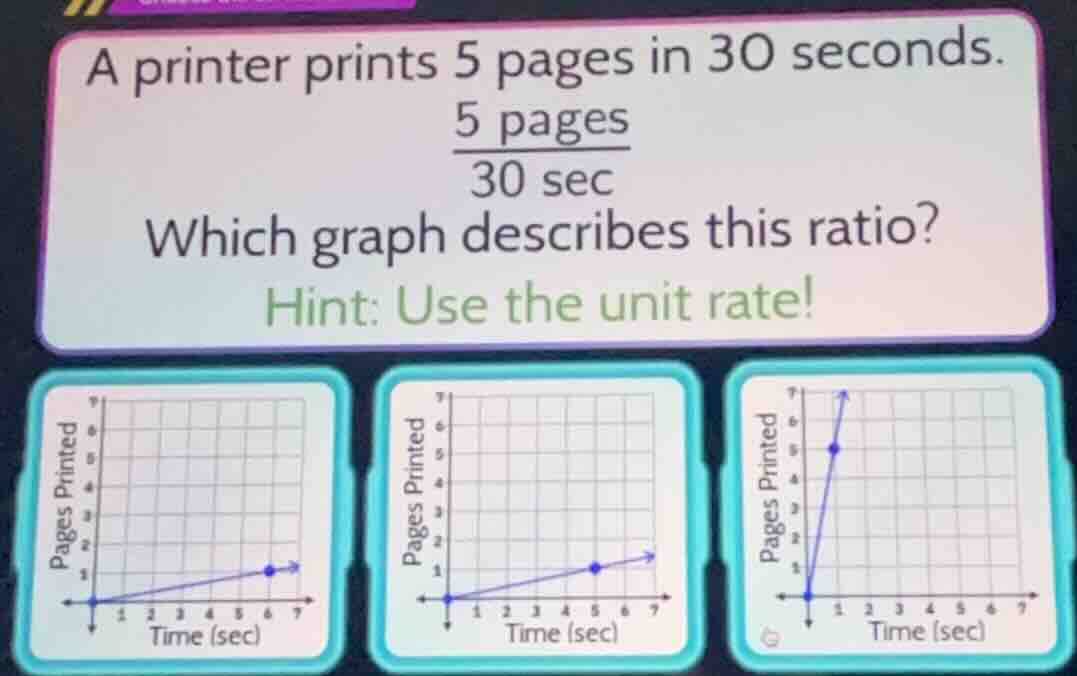
a printer prints 5 pages in 30 seconds.\\(\frac{5 \text{pages}}{30 \text{sec}}\\)\
which graph describes this ratio?\
hint: use the unit rate!
Step1: Calculate unit rate
First, find the unit rate (pages per second). The printer prints 5 pages in 30 seconds, so unit rate $r = \frac{5}{30}=\frac{1}{6}$ pages per second. Alternatively, seconds per page: $\frac{30}{5} = 6$ seconds per page.
Step2: Analyze the graphs
- For a proportional relationship (since printing pages over time is proportional), the graph should be a straight line through the origin with slope equal to the unit rate (pages per second) or its reciprocal (seconds per page).
- Let's check the slope. If we consider time (x - axis) and pages (y - axis), the slope $m=\frac{\text{pages}}{\text{time}}=\frac{5}{30}=\frac{1}{6}$. So for every 6 seconds, 1 page is printed, or for every 1 second, $\frac{1}{6}$ page is printed.
- Looking at the graphs, the first graph: Let's check the points. If x = 6 (seconds), y should be 1 (page) (since $\frac{1}{6}\times6 = 1$) or if we use the ratio 5 pages in 30 seconds, 1 page in 6 seconds. So when x = 6, y = 1. Wait, no, wait: the first graph has a point at (6,1)? Wait, no, the first graph: let's see the axes. The first graph: y - axis is pages printed, x - axis is time (sec). The point is at (6,1)? Wait, no, the second graph: wait, the problem has three graphs. Wait, the first graph: the point is at (6,1)? Wait, no, let's re - express.
Wait, the ratio is 5 pages in 30 seconds, so the unit rate of pages per second is $\frac{5}{30}=\frac{1}{6}$ pages per second. So the equation of the line is $y=\frac{1}{6}x$.
- Let's check x = 30, y should be 5. Or x = 6, y = 1; x = 12, y = 2, etc.
- Now, looking at the three graphs:
- The first graph: The line goes from (0,0) to (6,1) (since at x = 6, y = 1). Let's check: $\frac{1}{6}=\frac{y}{x}$, so y = $\frac{1}{6}x$. When x = 6, y = 1. That matches the unit rate.
- Wait, no, wait the second graph: the point is at (5,1)? No, the second graph's point is at (5,1)? Wait, no, the problem's hint says use unit rate. Let's recalculate. The unit rate of seconds per page is 6 seconds per page. So for 1 page, 6 seconds; for 5 pages, 30 seconds. So the line should pass through (6,1), (12,2), (18,3), (24,4), (30,5), etc.
- So the graph where when x (time) is 6, y (pages) is 1, or when x is 30, y is 5. Looking at the three graphs, the first graph: let's see the coordinates. The first graph: the point is at (6,1)? Wait, the first graph's point is at (6,1)? Wait, no, the first graph: the y - axis has marks up to 6, x - axis up to 7. The first graph's point is at (6,1)? Wait, the second graph's point is at (5,1)? No, the second graph's point is at (5,1)? Wait, I think I made a mistake. Wait, the ratio is 5 pages in 30 seconds, so the unit rate of pages per second is $\frac{5}{30}=\frac{1}{6}$ pages per second. So the slope of the line (pages vs time) is $\frac{1}{6}$. So the line should have a very shallow slope.
- Wait, the three graphs:
- First graph: The line is very shallow, going from (0,0) to (6,1) (since at x = 6, y = 1).
- Second graph: The line is also shallow, but the point is at (5,1)? No, that would be a slope of $\frac{1}{5}$, which is not equal to $\frac{1}{6}$.
- Third graph: The line is steep, which would imply a higher rate (like 5 pages in 1 second), which is wrong.
- So the correct graph is the first one? Wait, no, wait the second graph: wait, the problem's hint says "use the unit rate". Wait, maybe I mixed up x and y axes. Wait, maybe the x - axis is pages and y - axis is time? No, the axes are labeled: y - axis is pages printed, x - axis is time (sec). So the line should have a slope of…

Snap & solve any problem in the app
Get step-by-step solutions on Sovi AI
Photo-based solutions with guided steps
Explore more problems and detailed explanations
The left - most graph (the first graph) with the point at (6,1) (assuming the first graph is the one with the line from (0,0) to (6,1))