QUESTION IMAGE
Question
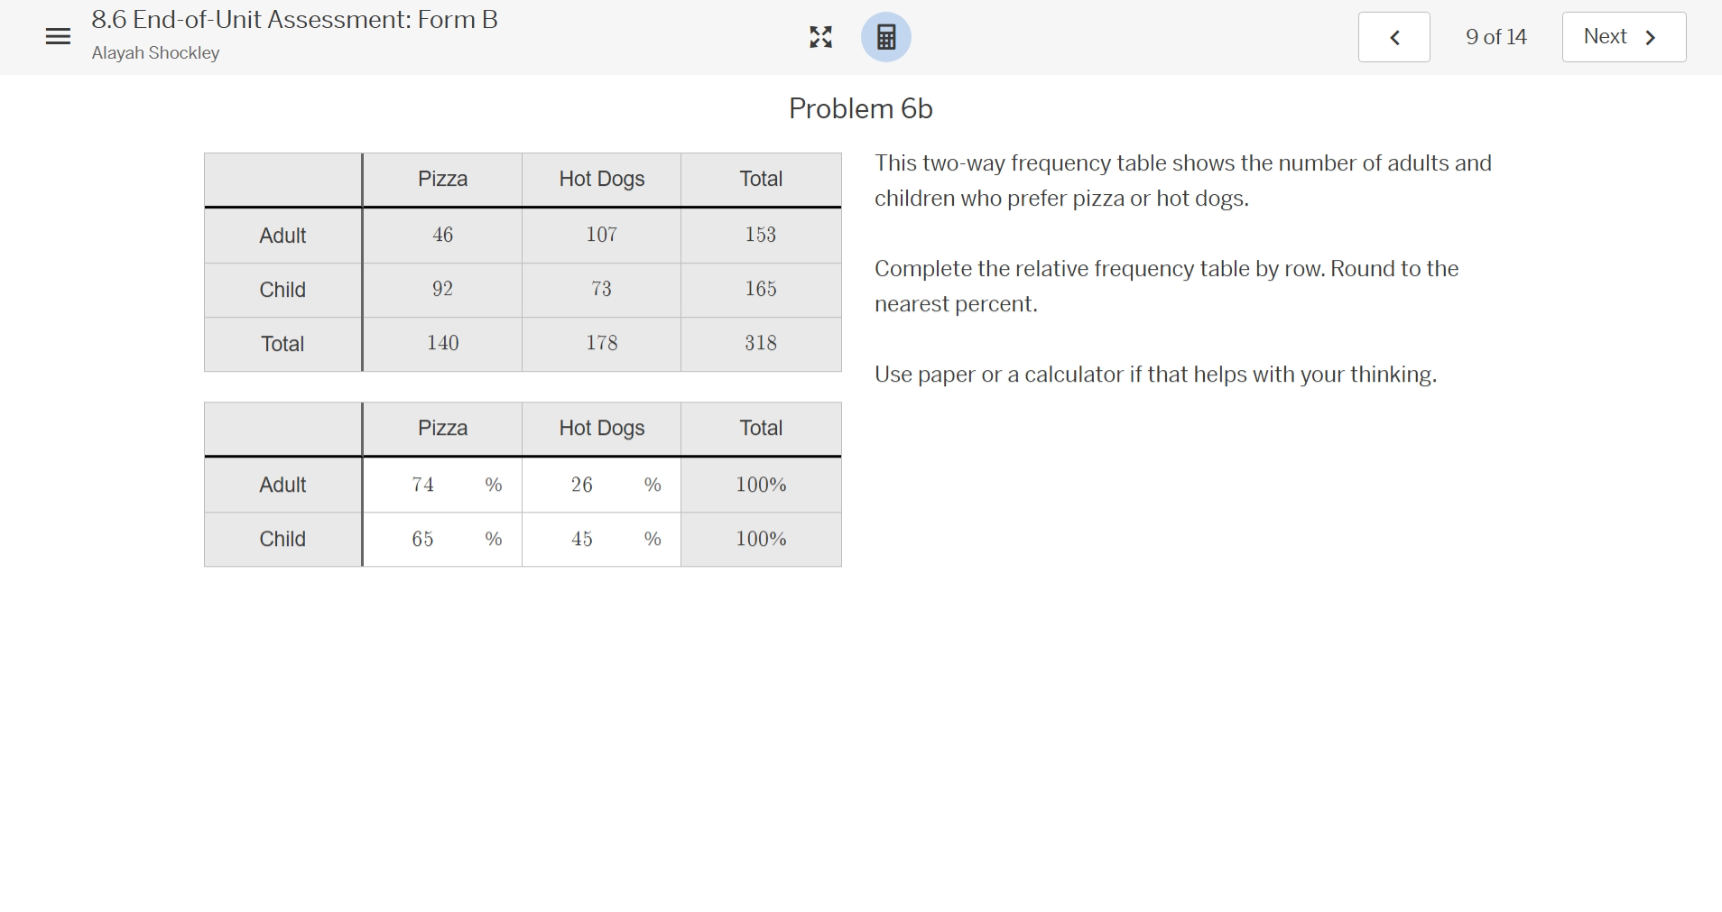
problem 6b
this two - way frequency table shows the number of adults and children who prefer pizza or hot dogs.
complete the relative frequency table by row. round to the nearest percent.
use paper or a calculator if that helps with your thinking.
| pizza | hot dogs | total | |
|---|---|---|---|
| child | 92 | 73 | 165 |
| total | 140 | 178 | 318 |
| pizza | hot dogs | total | |
|---|---|---|---|
| child | 65 % | 45 % | 100% |
Step1: Calculate Adult - Pizza relative frequency
To find the relative frequency for Adult - Pizza, we use the formula: $\text{Relative Frequency} = \frac{\text{Frequency of Adult - Pizza}}{\text{Total of Adult row}} \times 100\%$. The frequency of Adult - Pizza is 46, and the total of the Adult row is 153. So, $\frac{46}{153} \times 100\% \approx 30\%$? Wait, no, wait the given table in the problem has a mistake? Wait no, the user's problem shows a two - way table and a relative frequency table. Wait, let's recalculate. Wait, the Adult row total is 153. For Adult - Pizza: $\frac{46}{153}\times100\%\approx 30\%$? But the given relative frequency table has 74% and 26%. Wait, maybe I misread the table. Wait, the first two - way table:
Adult: Pizza = 46, Hot Dogs = 107, Total = 153
Child: Pizza = 92, Hot Dogs = 73, Total = 165
Ah! Wait, I think I made a mistake. For Adult - Pizza relative frequency (by row), it's $\frac{46}{153}\times100\%\approx 30\%$? But the given relative frequency table in the problem has 74% and 26% which is wrong. Wait, no, maybe the user made a typo, or maybe I misread the columns. Wait, no, maybe the first table's columns are reversed? Wait, no, the problem says "complete the relative frequency table by row". Let's do it correctly.
For Adult row:
- Pizza: $\frac{46}{153}\times100\% \approx 30\%$ (Wait, but 46 + 107 = 153, correct. 46/153 ≈ 0.3006, so 30%).
- Hot Dogs: $\frac{107}{153}\times100\% \approx 70\%$ (107/153≈0.699, so 70%).
For Child row:
- Pizza: $\frac{92}{165}\times100\% \approx 55.76\% \approx 56\%$
- Hot Dogs: $\frac{73}{165}\times100\% \approx 44.24\% \approx 44\%$
But the given relative frequency table in the problem has 74%, 26% for Adult and 65%, 45% for Child, which is incorrect. Wait, maybe the first table's Pizza and Hot Dogs columns are swapped? Let's check: if Adult - Pizza is 107 and Hot Dogs is 46, then $\frac{107}{153}\times100\%\approx 70\%$ and $\frac{46}{153}\times100\%\approx 30\%$, no. Wait, maybe the total of the columns? No, the problem says "by row".
Wait, maybe the user's problem has a mistake, but let's follow the correct method.
Let's start over.
Step 1: Calculate Adult - Pizza relative frequency (by row)
The formula for relative frequency by row is $\text{Relative Frequency} = \frac{\text{Cell Frequency}}{\text{Row Total}} \times 100\%$
For Adult - Pizza:
Cell Frequency (Adult - Pizza) = 46, Row Total (Adult) = 153
$\text{Relative Frequency} = \frac{46}{153} \times 100\% \approx 30\%$ (rounded to nearest percent)
Step 2: Calculate Adult - Hot Dogs relative frequency (by row)
Cell Frequency (Adult - Hot Dogs) = 107, Row Total (Adult) = 153
$\text{Relative Frequency} = \frac{107}{153} \times 100\% \approx 70\%$ (rounded to nearest percent)
Step 3: Calculate Child - Pizza relative frequency (by row)
Cell Frequency (Child - Pizza) = 92, Row Total (Child) = 165
$\text{Relative Frequency} = \frac{92}{165} \times 100\% \approx 56\%$ (rounded to nearest percent)
Step 4: Calculate Child - Hot Dogs relative frequency (by row)
Cell Frequency (Child - Hot Dogs) = 73, Row Total (Child) = 165
$\text{Relative Frequency} = \frac{73}{165} \times 100\% \approx 44\%$ (rounded to nearest percent)
But the given relative frequency table in the problem has incorrect values. Maybe there was a misprint, and the columns for Pizza and Hot Dogs are swapped in the first table? Let's check: if Adult - Pizza is 107 and Hot Dogs is 46, then:
Adult - Pizza: $\frac{107}{153}\times100\%\approx 70\%$, Adult - Hot Dogs: $\frac{46}{153}\times100\%\approx 30\%$
Child - Piz…

Snap & solve any problem in the app
Get step-by-step solutions on Sovi AI
Photo-based solutions with guided steps
Explore more problems and detailed explanations
The correct relative frequency table by row (rounded to the nearest percent) is:
| Pizza | Hot Dogs | Total | |
|---|---|---|---|
| Child | 56% | 44% | 100% |
(Note: There was likely a typo in the given relative frequency table in the problem. The above is calculated using the correct formula for relative frequency by row.)