QUESTION IMAGE
Question
question 15
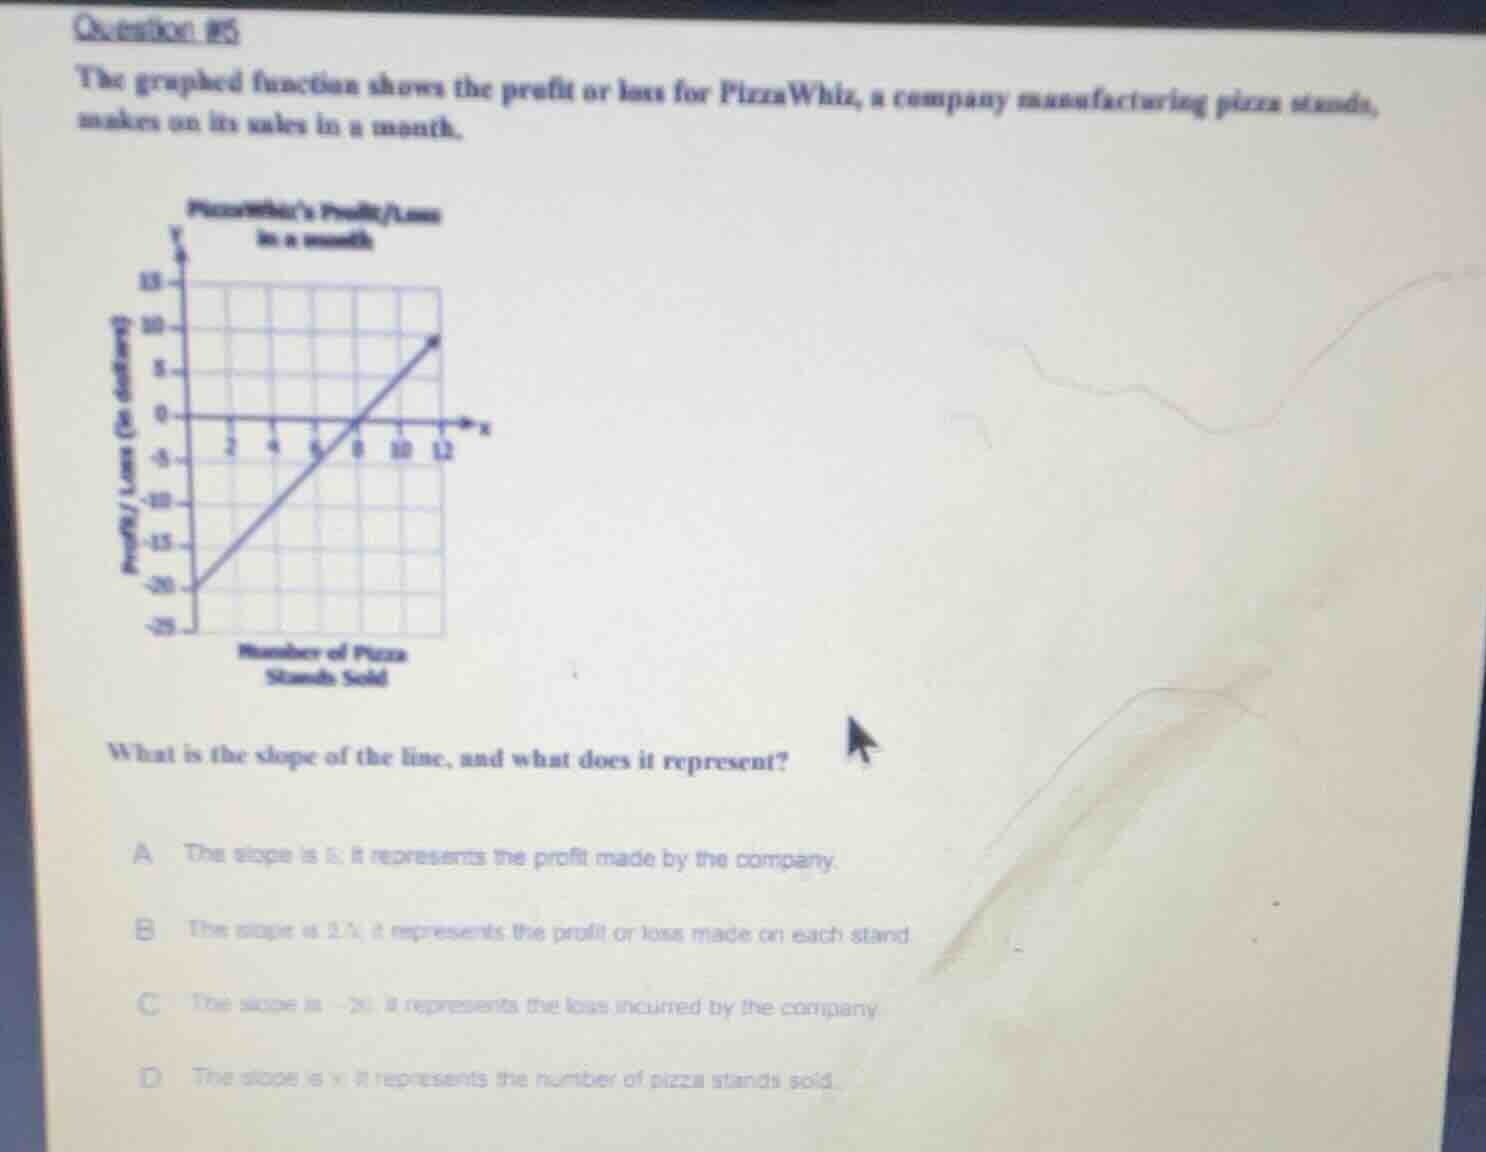
the graphed function shows the profit or loss for pizzawhiz, a company manufacturing pizza stands, makes on its sales in a month.
pizzawhizs profit/loss
in a month
number of pizza
stands sold
what is the slope of the line, and what does it represent?
a the slope is 5. it represents the profit made by the company.
b the slope is 2.5. it represents the profit or loss made on each stand
c the slope is -20. it represents the loss incurred by the company.
d the slope is x. it represents the number of pizza stands sold.
Step1: Identify two points on line
Use points $(0, -20)$ and $(8, 0)$
Step2: Calculate slope via formula
Slope formula: $m=\frac{y_2-y_1}{x_2-x_1}$
$m=\frac{0-(-20)}{8-0}=\frac{20}{8}=2.5$
Step3: Interpret slope meaning
Slope = $\frac{\text{Profit/Loss}}{\text{Number of Stands}}$, so it is the profit/loss per stand.

Snap & solve any problem in the app
Get step-by-step solutions on Sovi AI
Photo-based solutions with guided steps
Explore more problems and detailed explanations
B. The slope is 2.5; it represents the profit or loss made on each stand