QUESTION IMAGE
Question
question 26
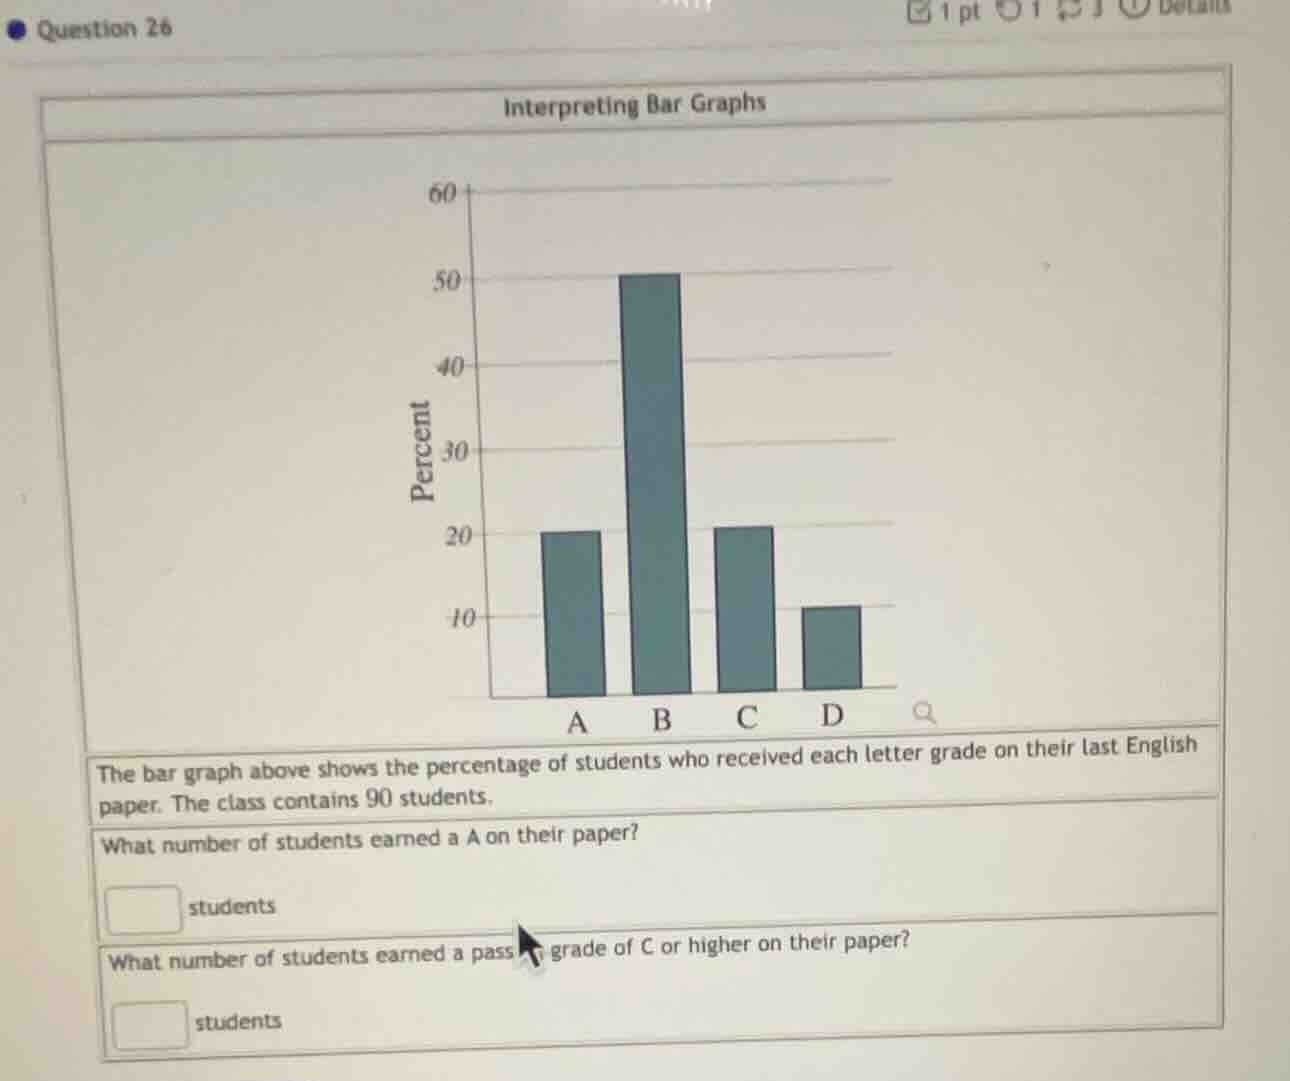
interpreting bar graphs
the bar graph above shows the percentage of students who received each letter grade on their last english paper. the class contains 90 students.
what number of students earned a a on their paper?
students
what number of students earned a passing grade of c or higher on their paper?
students
First Sub - Question: Number of students who earned an A
Step 1: Identify the percentage for grade A
From the bar graph, the percentage of students who earned an A is 20%.
Step 2: Calculate the number of students with grade A
The total number of students is 90. To find the number of students with grade A, we use the formula: Number of students = (Percentage / 100)×Total number of students. So, for grade A, it is $\frac{20}{100}×90 = 0.2×90 = 18$.
Step 1: Identify the percentages for grades A, B, and C
From the bar graph, the percentage for grade A is 20%, for grade B is 50%, and for grade C is 20%.
Step 2: Calculate the total percentage for grades A, B, and C
The total percentage of students with grade C or higher is $20\%+ 50\%+20\%=90\%$.
Step 3: Calculate the number of students with grade C or higher
Using the formula: Number of students = (Percentage / 100)×Total number of students. So, it is $\frac{90}{100}×90 = 0.9×90 = 81$.

Snap & solve any problem in the app
Get step-by-step solutions on Sovi AI
Photo-based solutions with guided steps
Explore more problems and detailed explanations
18