QUESTION IMAGE
Question
question 27
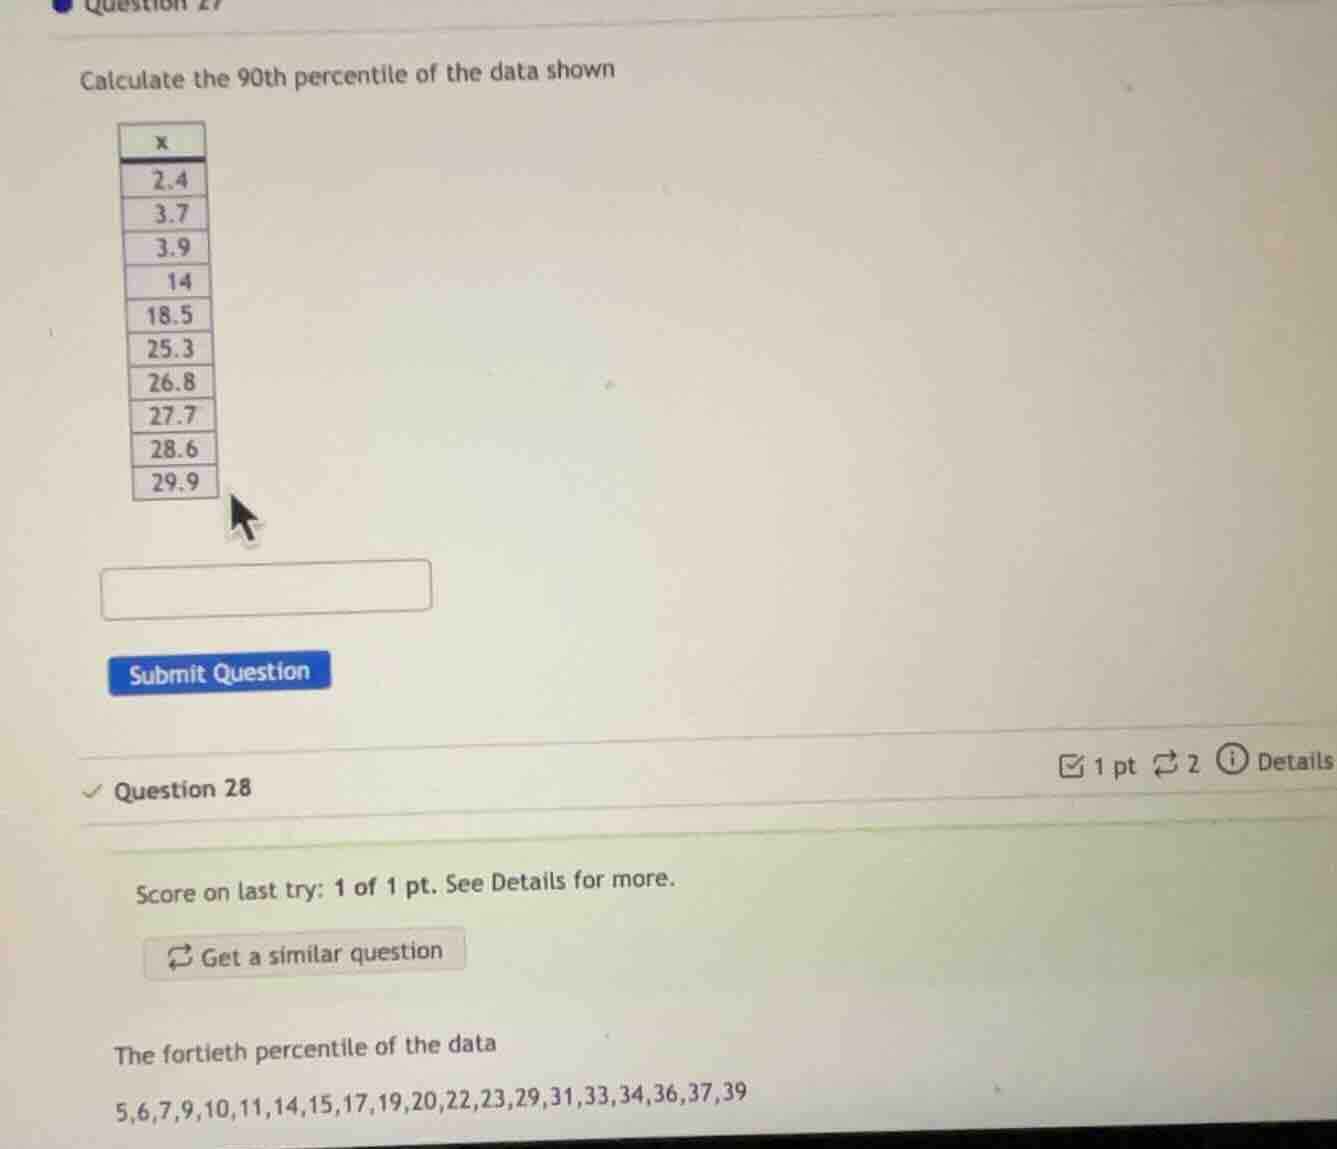
calculate the 90th percentile of the data shown
x
2.4
3.7
3.9
14
18.5
25.3
26.8
27.7
28.6
29.9
submit question
question 28
score on last try: 1 of 1 pt. see details for more.
get a similar question
the fortieth percentile of the data
5,6,7,9,10,11,14,15,17,19,20,22,23,29,31,33,34,36,37,39
Question 27: Calculate the 90th percentile of the data shown
Step 1: Determine the number of data points
The data set is: \(2.4, 3.7, 3.9, 14, 18.5, 25.3, 26.8, 27.7, 28.6, 29.9\). The number of data points \(n = 10\).
Step 2: Calculate the index \(i\) for the 90th percentile
The formula for the index \(i\) is \(i=\frac{p}{100}\times n\), where \(p = 90\) and \(n = 10\).
So, \(i=\frac{90}{100}\times10 = 9\).
Since \(i\) is an integer, the 90th percentile is the average of the value at position \(i\) and \(i + 1\). But wait, for \(n = 10\), the positions are 1 to 10. Wait, actually, when \(i\) is an integer, the percentile is the value at position \(i\) (if we consider 1 - based indexing) or we need to check the method. Wait, another method: for a data set with \(n\) observations, the position of the \(p\)th percentile is \(L_p=\frac{p}{100}(n - 1)+1\). Let's use this method (the linear interpolation method for percentiles).
So, \(L_{90}=\frac{90}{100}(10 - 1)+1=\frac{90}{100}\times9 + 1=8.1 + 1=9.1\).
This means the 90th percentile is between the 9th and 10th values. The 9th value is \(28.6\) and the 10th value is \(29.9\).
The formula for linear interpolation is: \(P_p=x_{(i)}+(L_p - i)(x_{(i + 1)}-x_{(i)})\), where \(i=\lfloor L_p
floor=9\), \(x_{(9)} = 28.6\), \(x_{(10)} = 29.9\), and \(L_p - i=9.1 - 9 = 0.1\).
So, \(P_{90}=28.6+0.1\times(29.9 - 28.6)=28.6 + 0.1\times1.3=28.6+0.13 = 28.73\)? Wait, no, maybe I made a mistake. Wait, alternatively, some methods use the "nearest - rank" method. For the nearest - rank method, the rank \(r=\lceil\frac{p}{100}\times n
ceil\). For \(p = 90\), \(n = 10\), \(r=\lceil0.9\times10
ceil=\lceil9
ceil = 9\)? No, \(0.9\times10 = 9\), so if we use the rule that if \(i\) is an integer, the percentile is the average of the \(i\)th and \((i + 1)\)th values (for \(i\) from 1 to \(n\)). Wait, the data has 10 points. Let's list the sorted data (it is already sorted):
1: \(2.4\)
2: \(3.7\)
3: \(3.9\)
4: \(14\)
5: \(18.5\)
6: \(25.3\)
7: \(26.8\)
8: \(27.7\)
9: \(28.6\)
10: \(29.9\)
The formula for percentile using the "inclusive" method: \(i=\frac{p}{100}(n + 1)\). For \(p = 90\), \(n = 10\), \(i=\frac{90}{100}(10 + 1)=9.9\). So we take the 9th and 10th values. The 9th value is \(28.6\), the 10th is \(29.9\). The difference is \(29.9 - 28.6 = 1.3\). We take \(0.9\) of the way from the 9th to the 10th. So \(28.6+0.9\times1.3=28.6 + 1.17=29.77\)? Wait, I think I confused the methods. Let's check a standard method. The most common method for percentiles (used in many textbooks) is:
- Order the data from smallest to largest (already done here).
- Calculate the index \(i=\frac{p}{100}\times n\), where \(n\) is the number of data points.
- If \(i\) is not an integer, round up to the next integer. The value at that position is the percentile.
- If \(i\) is an integer, the percentile is the average of the values at positions \(i\) and \(i + 1\) (if \(i+1\leq n\)).
For \(p = 90\), \(n = 10\), \(i=\frac{90}{100}\times10 = 9\). Since \(i\) is an integer, we take the average of the 9th and 10th values. The 9th value is \(28.6\), the 10th is \(29.9\). So the average is \(\frac{28.6 + 29.9}{2}=\frac{58.5}{2}=29.25\). Wait, that makes sense. Because when \(i\) is an integer, the percentile is the average of the \(i\)th and \((i + 1)\)th observations (for \(i=1,\cdots,n - 1\)). Since \(i = 9\) and \(n = 10\), \(i+1 = 10\leq10\), so we average the 9th and 10th values.
Step 3: Calculate the average of the 9th and 10th values
The 9th value \(x_9 = 28.6\), the 10th value \(x_{10}=29.9\).
The average is \(\frac{28.6+29.9}{2}=\frac{58.5}{2}=29.25…
Step 1: Determine the number of data points
The data set has \(n = 20\) data points.
Step 2: Calculate the index \(i\) for the 40th percentile
Using the formula \(i=\frac{p}{100}\times n\), where \(p = 40\) and \(n = 20\).
So, \(i=\frac{40}{100}\times20 = 8\).
Since \(i\) is an integer, we take the average of the values at positions \(i\) and \(i + 1\) (where positions are 1 - based).
Step 3: Identify the 8th and 9th values
The sorted data (already sorted) is:
1: \(5\)
2: \(6\)
3: \(7\)
4: \(9\)
5: \(10\)
6: \(11\)
7: \(14\)
8: \(15\)
9: \(17\)
10: \(19\)
11: \(20\)
12: \(22\)
13: \(23\)
14: \(29\)
15: \(31\)
16: \(33\)
17: \(34\)
18: \(36\)
19: \(37\)
20: \(39\)
The 8th value \(x_8 = 15\), the 9th value \(x_9 = 17\).
Step 4: Calculate the average of the 8th and 9th values
The average is \(\frac{15 + 17}{2}=\frac{32}{2}=16\).

Snap & solve any problem in the app
Get step-by-step solutions on Sovi AI
Photo-based solutions with guided steps
Explore more problems and detailed explanations
\(29.25\)