QUESTION IMAGE
Question
question
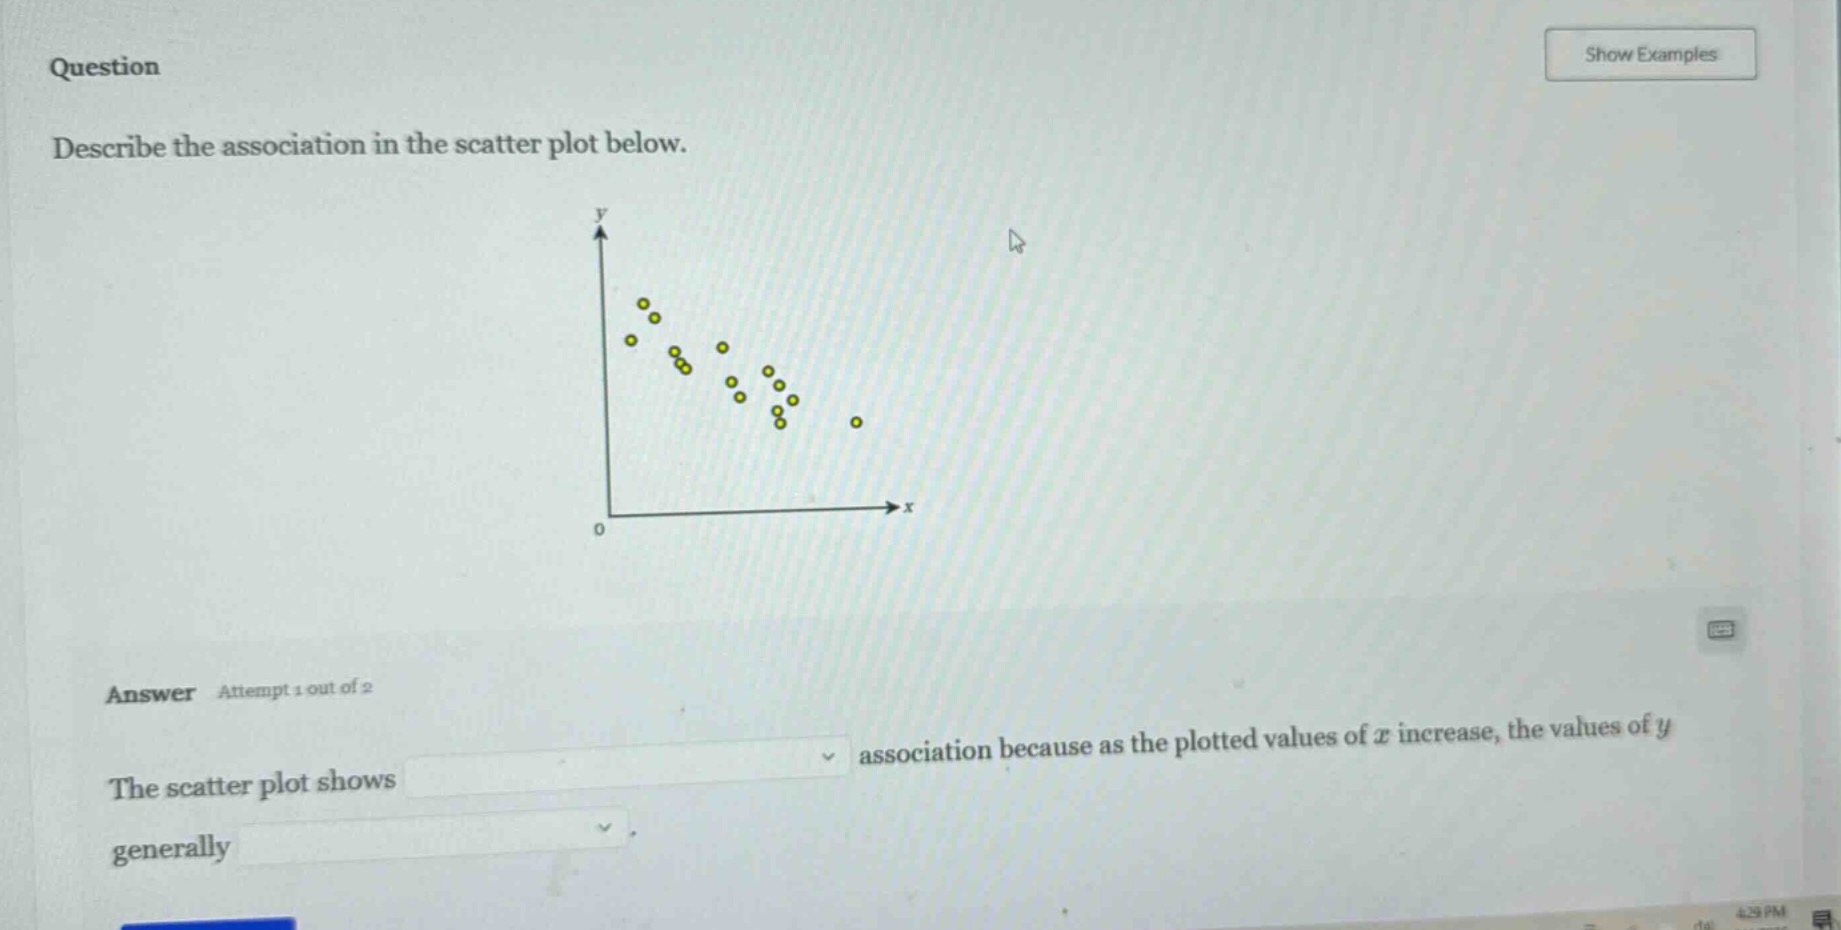
describe the association in the scatter plot below.
answer attempt 1 out of 2
the scatter plot shows
association because as the plotted values of ( x ) increase, the values of ( y ) generally
To describe the association in a scatter plot, we analyze the direction (positive/negative), form (linear/non - linear), and strength (strong/moderate/weak). Looking at the given scatter plot, as the x - values increase, the y - values tend to decrease. The points show a somewhat consistent downward trend, so the association is linear (since the points roughly follow a straight - line pattern) and negative (because of the downward trend). So the first blank should be filled with "a negative (and linear)" (or just "a negative" as the linearity can be inferred from the trend) and the second blank with "decrease".

Snap & solve any problem in the app
Get step-by-step solutions on Sovi AI
Photo-based solutions with guided steps
Explore more problems and detailed explanations
The scatter plot shows a negative (linear) association because as the plotted values of \( x \) increase, the values of \( y \) generally decrease.