QUESTION IMAGE
Question
question
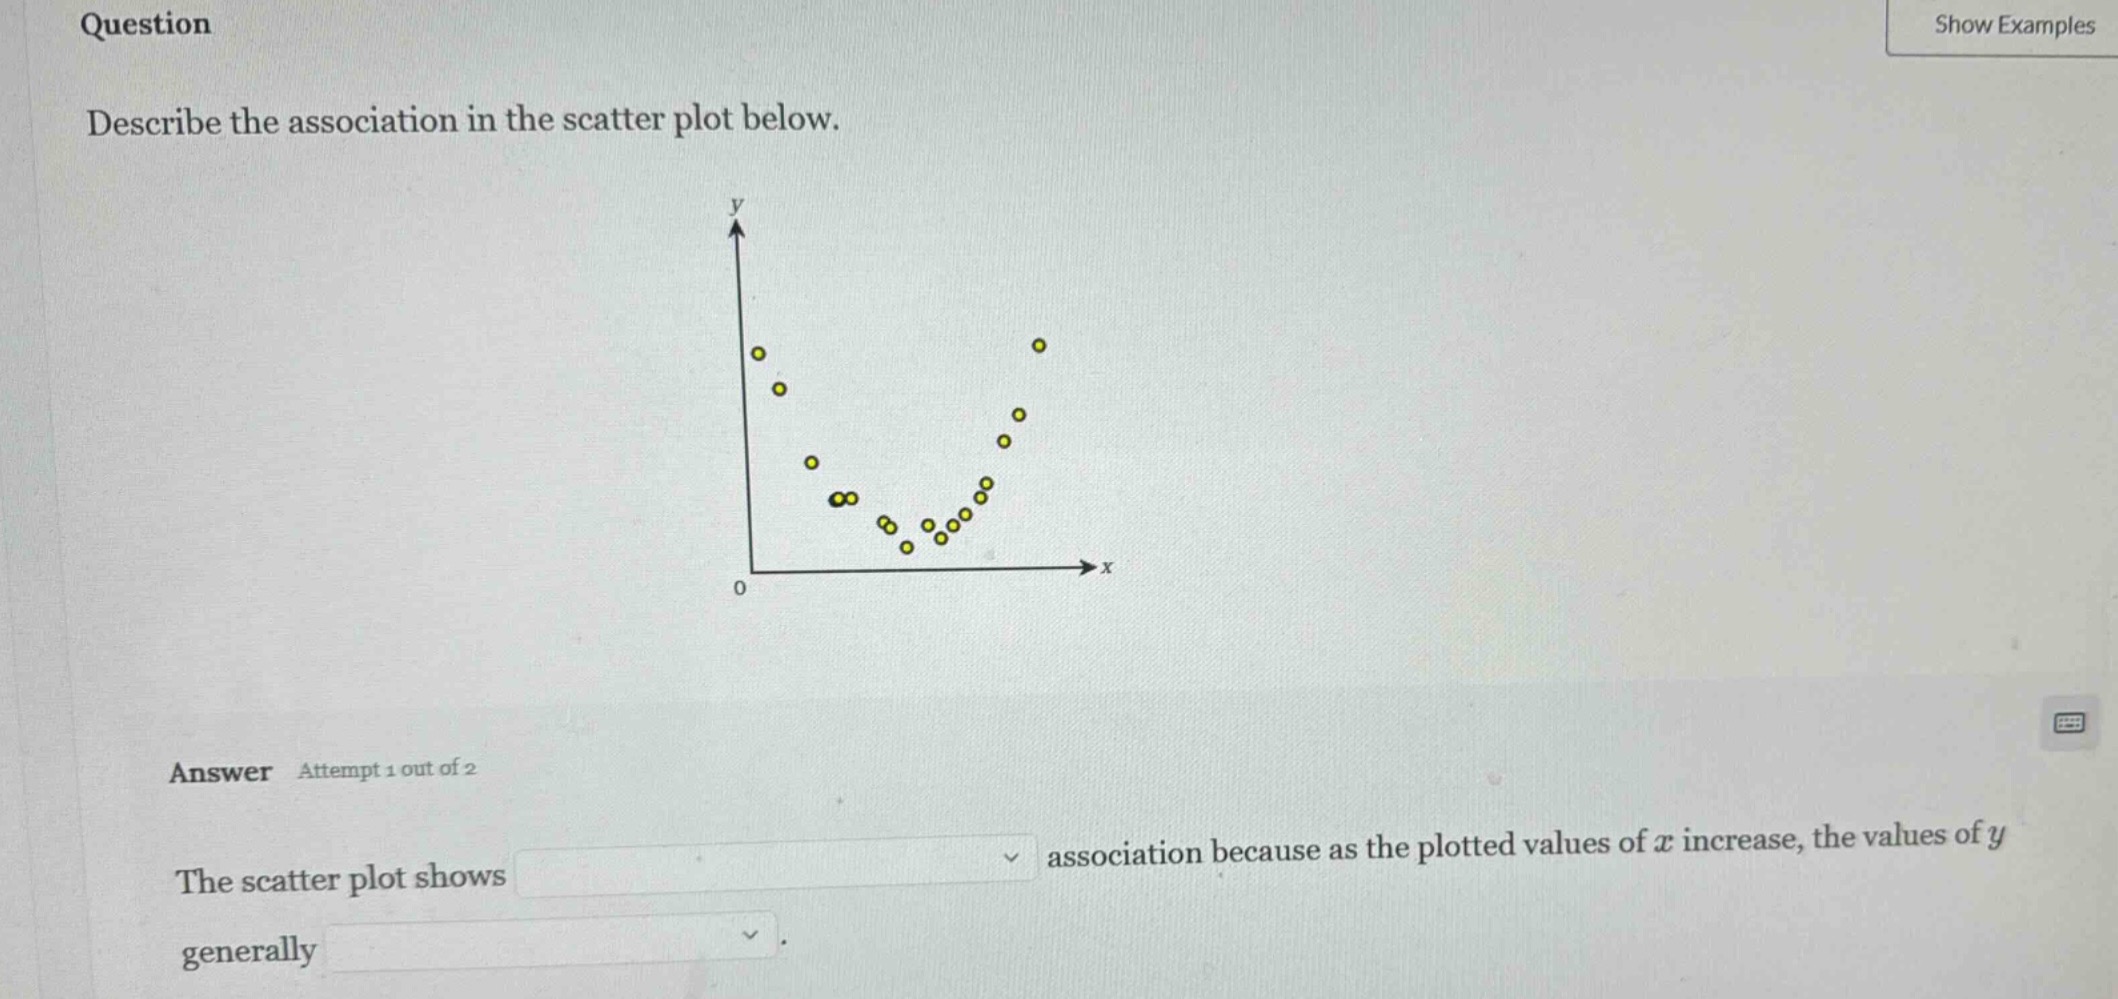
describe the association in the scatter plot below.
answer attempt 1 out of 2
the scatter plot shows
association because as the plotted values of ( x ) increase, the values of ( y ) generally
.
To describe the association in a scatter plot, we analyze the direction (positive/negative/non - linear), form (linear/non - linear), and strength (strong/moderate/weak) of the relationship between \(x\) and \(y\). Looking at the given scatter plot, the points seem to follow a U - shaped pattern. So, the association is non - linear. Also, as \(x\) increases, \(y\) first decreases and then increases, which means that overall, the relationship is a non - linear (specifically a quadratic - like) association. For the first blank, we need to identify the type of association. Since it's not a straight - line (linear) relationship, it's a non - linear association. For the second blank, as \(x\) increases, \(y\) first decreases and then increases, so we can say that \(y\) decreases then increases (or in the context of the options, since it's a non - linear association with a U - shape, the behavior of \(y\) with respect to \(x\) is that it decreases to a minimum and then increases, so the general trend when considering the overall shape is a non - linear association where \(y\) has a pattern of decreasing then increasing, but in the given sentence structure, the first blank is about the type of association (non - linear) and the second blank is about the behavior of \(y\) as \(x\) increases. So the first blank should be "a non - linear" and the second blank should be "decrease then increase" (or in the context of the dropdowns, likely "a non - linear" for the first and "decrease then increase" for the second, but based on the scatter plot's shape (U - curve), the association is non - linear and as \(x\) increases, \(y\) first decreases and then increases).

Snap & solve any problem in the app
Get step-by-step solutions on Sovi AI
Photo-based solutions with guided steps
Explore more problems and detailed explanations
The scatter plot shows \(\boldsymbol{\text{a non - linear}}\) association because as the plotted values of \(x\) increase, the values of \(y\) generally \(\boldsymbol{\text{decrease then increase}}\).